
Coin Metrics: Why has the current bitcoin cycle been extended?

With institutions stepping in and volatility cooling down, bitcoin is entering a smoother and more mature cycle.
Institutional absorption combined with cooling volatility indicates that Bitcoin is entering a smoother, more mature cycle.
Written by: Tanay Ved
Translated by: Luffy, Foresight News
TL;TR
- As long-term holders gradually sell and new participants absorb the supply, Bitcoin’s supply turnover is slowing down, presenting a smoother state of ownership transfer.
- Since the beginning of 2024, spot Bitcoin ETFs and Digital Asset Treasuries (DAT) alone have absorbed about 57% of the incremental supply from short-term holders, and now account for nearly a quarter of the total circulating Bitcoin over the past year.
- Realized volatility continues to stabilize, marking the market structure’s move toward maturity, characterized by institutional demand dominance and extended cycle rhythms.
After reaching an all-time high earlier this year, Bitcoin has mostly been in a consolidation phase, briefly falling below the $100,000 mark for the first time since June. Macro headwinds, a weak stock market, and a rare large-scale crypto liquidation event have collectively dampened market sentiment, slowed capital inflows, and sparked doubts about the sustainability of the Bitcoin bull market. In addition, concerns about large holders transferring or selling early positions have intensified, putting pressure on Bitcoin and the broader crypto market. After the recent decline, the current total crypto market capitalization is about $3.6 trillion.
Beneath the surface, Bitcoin’s on-chain data provides important context. In this article, we will explore how changes in Bitcoin holder behavior and core demand drivers are influencing market sentiment and defining the rhythm of this cycle. By analyzing changes in active supply and demand channels, we will examine whether recent market volatility signals end-of-cycle profit-taking or a structural shift in Bitcoin ownership.
Supply Distribution and Institutional Absorption
Active Supply
First, let’s look at Bitcoin’s active supply, which is categorized by the “time since last on-chain movement,” reflecting the liquidity of tokens held for different durations and clearly showing the distribution between “dormant tokens” and “recently moved tokens.”
The chart below separately lists the proportion of Bitcoin supply that has not moved for over a year, which can serve as a proxy for the holdings of long-term holders (LTH). Historically, this ratio rises during bear markets (tokens concentrate among long-term holders) and falls during bull markets (long-term holders start moving tokens, taking profits and selling at highs).

Data source: Coin Metrics Network Data Pro
As of now, out of 19.94 million circulating Bitcoins, about 52% have not moved for over a year, down from 61% at the start of 2024. Both the increase during bear markets and the decrease during bull markets have become noticeably more moderate. There have been phased sell-offs in Q1 2024, Q3 2024, and recently in 2025. This indicates that long-term holders are selling tokens in a more sustained manner, reflecting an extension of the ownership transfer cycle.
ETF and DAT: Core Demand Drivers
In contrast, since 2024, the supply from short-term holders (tokens active within the past year) has steadily increased as previously dormant tokens re-enter circulation. Meanwhile, the launch of spot Bitcoin ETFs and the accelerated accumulation by Digital Asset Treasuries (DAT) have brought new, sustained demand, absorbing the supply distributed by long-term holders.
As of November 2025, the number of Bitcoins active within the past year is 7.83 million, up about 34% from 5.86 million at the start of 2024 (dormant tokens returning to circulation). During the same period, the holdings of spot Bitcoin ETFs and Strategy’s asset treasuries increased from about 600,000 Bitcoins to 1.9 million, absorbing nearly 57% of the net increase in short-term holder supply. Currently, these two channels account for about 23% of the short-term holder supply.
Although capital inflows have slowed in recent weeks, the overall trend shows that supply is gradually shifting to more stable, long-term holding channels, which is a unique feature of the current market structure in this cycle.

Data source: Coin Metrics Network Data Pro & Bitbo Treasuries; Note: ETF supply excludes Fidelity FBTC, DAT supply includes Strategy
Short-term vs. Long-term Holder Behavior
Realized profit trends further confirm the smoothing characteristics of Bitcoin’s supply dynamics. The Spent Output Profit Ratio (SOPR) is used to measure whether holders are selling tokens at a profit or loss, clearly reflecting the behavioral patterns of different holder groups throughout the market cycle.
In past cycles, the realized profits and losses of long-term and short-term holders often showed dramatic, synchronized swings. Recently, however, this relationship has diverged: long-term holder SOPR remains slightly above 1, indicating they are steadily realizing profits and selling moderately at highs.
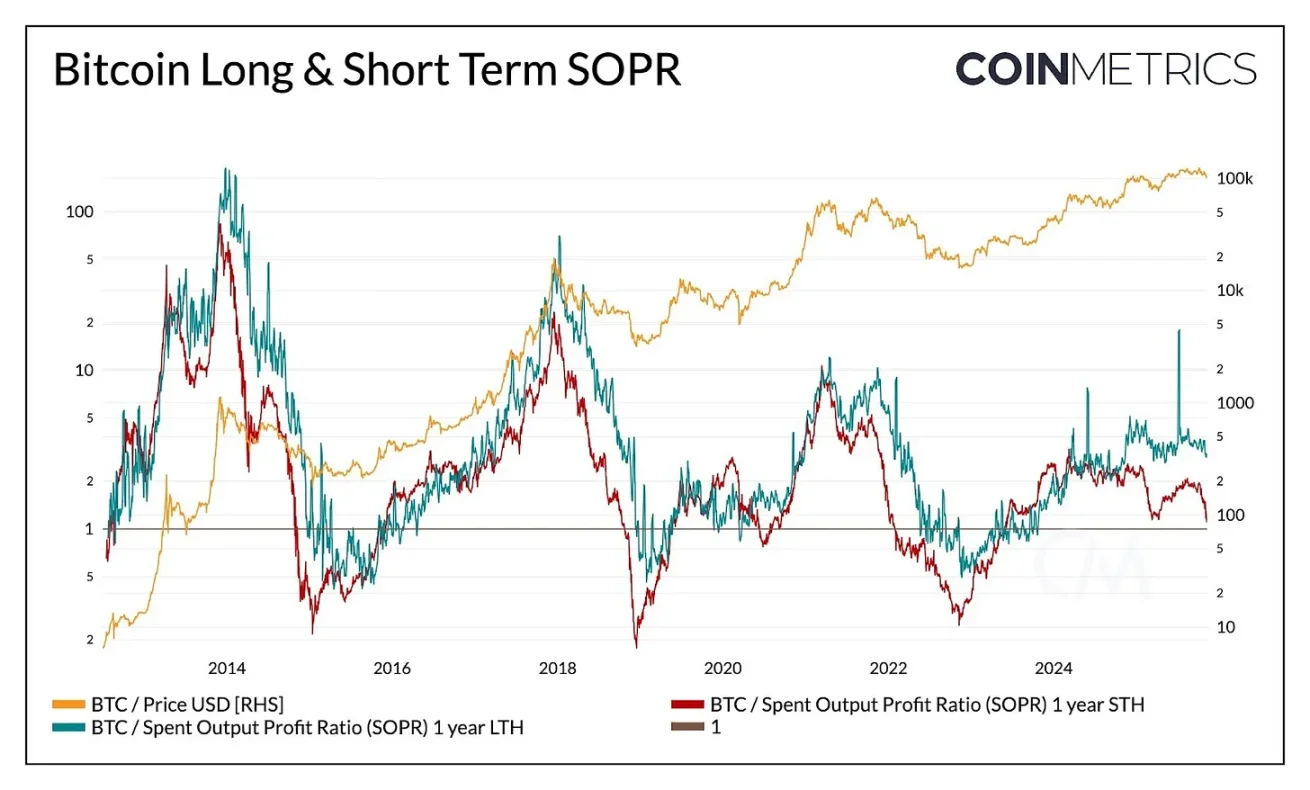
Data source: Coin Metrics Network Data Pro
The SOPR for short-term holders hovers near the breakeven line, which also explains the recent cautious market sentiment, as many short-term holders’ positions are close to their cost basis. The behavioral divergence between the two types of holders reflects that the market is in a smoother phase: institutional demand is absorbing the supply distributed by long-term holders, rather than repeating the dramatic ups and downs of the past. If short-term holder SOPR consistently breaks above 1, it could signal strengthening market momentum.
Although a broad correction would still compress the profitability of all holder groups, the overall pattern shows a more balanced market structure: both supply turnover and profit realization are progressing gradually, extending Bitcoin’s cycle rhythm.
Declining Bitcoin Volatility
This structural smoothing is also reflected in Bitcoin’s volatility, which has shown a long-term downward trend. Currently, Bitcoin’s 30-day, 60-day, 180-day, and 360-day realized volatility is stable at around 45%-50%, whereas in the past, its volatility was often explosive, causing wild market swings. Now, Bitcoin’s volatility characteristics are increasingly resembling those of large tech stocks, indicating its maturity as an asset. This not only reflects improved liquidity but also a more institutionally dominated investor base.
For asset allocators, declining volatility may enhance Bitcoin’s appeal in investment portfolios, especially as its correlation with stocks, gold, and other macro assets remains dynamically variable.

Data source: Coin Metrics Market Data Pro
Conclusion
Bitcoin’s on-chain trends indicate that this cycle is progressing in a smoother, longer phase, without the frenzied surges seen in previous bull markets. Long-term holders are selling in batches, with most of the supply being absorbed by more sustained demand channels (ETFs, DAT, and broader institutional holdings). This shift marks the market structure’s move toward maturity: declining volatility and turnover, and extended cycles.
Nevertheless, market momentum still depends on the persistence of demand. Flattening ETF inflows, pressure on some DATs, recent market-wide liquidation events, and short-term holder SOPR hovering near breakeven all highlight that the market is in a phase of readjustment. Continued growth in long-term holder supply (tokens unmoved for over a year), SOPR breaking above 1, and renewed inflows into spot Bitcoin ETFs and stablecoins could all be key signals for a return of market momentum.
Looking ahead, easing macro uncertainty, improved liquidity conditions, and regulatory progress related to market structure could reignite capital inflows and extend the bull market cycle. Although market sentiment has cooled, after the recent deleveraging adjustment, the market foundation is healthier, supported by the expansion of institutional channels and the proliferation of on-chain infrastructure.
Disclaimer: The content of this article solely reflects the author's opinion and does not represent the platform in any capacity. This article is not intended to serve as a reference for making investment decisions.
You may also like


Polkadot Hub + PDP: Rewrite Rollup Deployment Rules to Accelerate Ecosystem Explosion!
