
Ethereum Price Reaches Support, Can ETH Start A Steady Increase Again?
Ethereum price extended losses and tested the $2,300 support. ETH is now attempting a recovery wave above the $2,340 level and might test $2,390.
- Ethereum started a fresh decline below the $2,420 and $2,400 levels.
- The price is trading below $2,400 and the 100-hourly Simple Moving Average.
- There was a break above a connecting bearish trend line with resistance near $2,340 on the hourly chart of ETH/USD (data feed via Kraken).
- The pair attempt a fresh increase if it clears the $2,390 and $2,400 levels.
Ethereum Price Revisits $2,300
Ethereum price struggled to start a fresh increase above the $2,550 and $2,580 resistance levels. ETH started a fresh decline and traded below the $2,400 support like Bitcoin .
There was a move below the $2,350 level. A new weekly low was formed near $2,302 and the price is now consolidating losses. There was a minor increase above the $2,330 level. The price climbed above the 23.6% Fib retracement level of the downward move from the $2,479 swing high to the $2,302 low.
There was also a break above a connecting bearish trend line with resistance near $2,340 on the hourly chart of ETH/USD. Ethereum is now trading below $2,400 and the 100-hourly Simple Moving Average . On the upside, the price is facing resistance near the $2,365 level.
The next hurdle could be $2,390 or the 50% Fib retracement level of the downward move from the $2,479 swing high to the $2,302 low. The next major resistance is now near $2,400. A clear move above the $2,400 level might start a decent increase. In the stated case, the price could rise toward the $2,480 level.
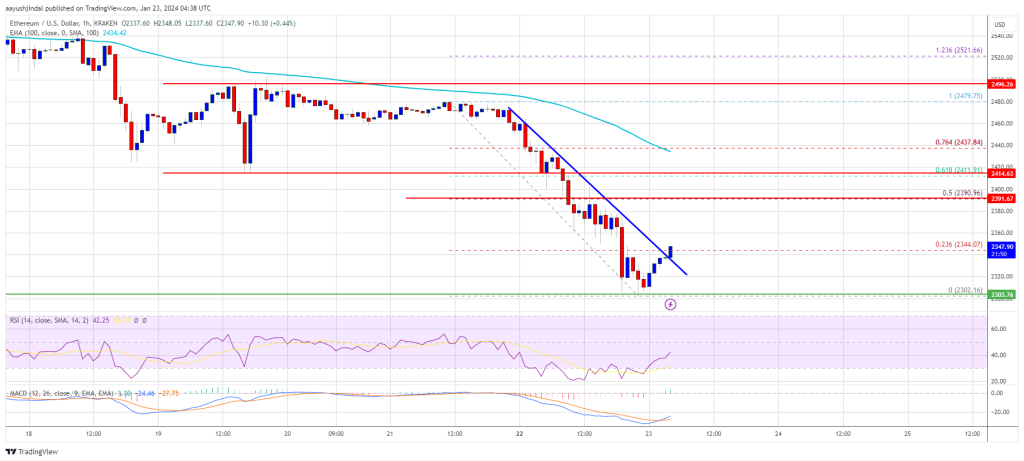
Source: ETHUSD on TradingView.com
The next key hurdle sits near the $2,500 zone. A close above the $2,500 resistance could start another steady increase. In the stated case, Ether price could rise toward the $2,650 zone.
Another Decline in ETH?
If Ethereum fails to clear the $2,390 resistance, it could start another decline. Initial support on the downside is near the $2,320 level.
The next key support could be the $2,300 zone. A downside break below the $2,300 support might send the price further lower. In the stated case, Ether could test the $2,250 support. Any more losses might send the price toward the $2,200 level.
Technical Indicators
Hourly MACD – The MACD for ETH/USD is losing momentum in the bearish zone.
Hourly RSI – The RSI for ETH/USD is now below the 50 level.
Major Support Level – $2,300
Major Resistance Level – $2,390
Disclaimer: The content of this article solely reflects the author's opinion and does not represent the platform in any capacity. This article is not intended to serve as a reference for making investment decisions.
You may also like
2025 TGE Survival Ranking: Who Will Rise to the Top and Who Will Fall? Complete Grading of 30+ New Tokens, AVICI Dominates S+
The article analyzes the TGE performance of multiple blockchain projects, evaluating project performance using three dimensions: current price versus all-time high, time span, and liquidity-to-market cap ratio. Projects are then categorized into five grades: S, A, B, C, and D. Summary generated by Mars AI This summary was generated by the Mars AI model, and the accuracy and completeness of its content are still being iteratively updated.

Mars Finance | "Machi" increases long positions, profits exceed 10 million dollars, whale shorts 1,000 BTC
Russian households have invested 3.7 billion rubles in cryptocurrency derivatives, mainly dominated by a few large players. INTERPOL has listed cryptocurrency fraud as a global threat. Malicious Chrome extensions are stealing Solana funds. The UK has proposed new tax regulations for DeFi. Bitcoin surpasses $91,000. Summary generated by Mars AI. The accuracy and completeness of this summary are still being iteratively updated by the Mars AI model.

How much is ETH really worth? Hashed provides 10 different valuation methods in one go
After taking a weighted average, the fair price of ETH exceeds $4,700.

Dragonfly partner: Crypto has fallen into financial cynicism, and those valuing public blockchains with PE ratios have already lost
People tend to overestimate what can happen in two years, but underestimate what can happen in ten years.
