
Bitcoin Price Restarts Increase – Can BTC Pump To $45K Again?
Bitcoin price is recovering higher above the $42,000 resistance. BTC must clear $42,800 and $43,500 to start an increase toward the $45,000 resistance.
- Bitcoin price is moving higher above the $42,000 resistance zone.
- The price is trading above $41,500 and the 100 hourly Simple moving average.
- There is a key bullish trend line forming with support near $41,500 on the hourly chart of the BTC/USD pair (data feed from Kraken).
- The pair could start a steady increase if it clears the $42,800 and $43,500 resistance levels.
Bitcoin Price Aims Higher
Bitcoin price formed a support base above the $40,000 support zone . BTC started a decent increase above the $41,200 and $41,500 resistance levels.
It opened the doors for more gains above $42,000 and the 100 hourly Simple moving average. Finally, the price tested the $42,800 zone. A high was formed near $42,800 before there was a minor decline. The price declined below the $42,200 level.
Bitcoin tested the 23.6% Fib retracement level of the upward move from the $38,518 swing low to the $42,800 high. There is also a key bullish trend line forming with support near $41,500 on the hourly chart of the BTC/USD pair.
The price is now trading above $41,500 and the 100 hourly Simple moving average . Immediate resistance is near the $42,500 level. The next key resistance could be $42,800, above which the price could rise and test $43,500.
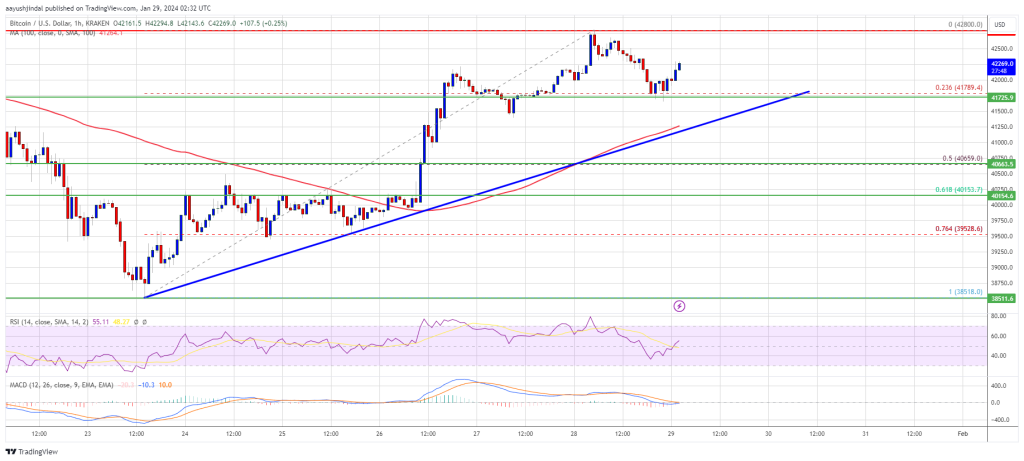
Source: BTCUSD on TradingView.com
A clear move above the $43,500 resistance could send the price toward the $44,250 resistance. The next resistance is now forming near the $45,000 level. A close above the $45,000 level could push the price further higher. The next major resistance sits at $46,500.
Another Drop In BTC?
If Bitcoin fails to rise above the $42,800 resistance zone, it could start another decline. Immediate support on the downside is near the $41,750 level.
The next major support is $41,500 and the trend line. If there is a close below $41,500, the price could gain bearish momentum. In the stated case, the price could dive toward the $40,650 support or the 50% Fib retracement level of the upward move from the $38,518 swing low to the $42,800 high in the near term.
Technical indicators:
Hourly MACD – The MACD is now gaining pace in the bullish zone.
Hourly RSI (Relative Strength Index) – The RSI for BTC/USD is now above the 50 level.
Major Support Levels – $41,500, followed by $40,650.
Major Resistance Levels – $42,800, $43,500, and $45,000.
Disclaimer: The content of this article solely reflects the author's opinion and does not represent the platform in any capacity. This article is not intended to serve as a reference for making investment decisions.
You may also like
Infighting, scandals, and a stock price plunge: What can DAT rely on to survive?

Price predictions 11/28: BTC, ETH, XRP, BNB, SOL, DOGE, ADA, HYPE, BCH, LINK

Ethereum Privacy’s HTTPS Moment: From Defensive Tool to Default Infrastructure
A summary of the "Holistic Reconstruction of Privacy Paradigms" based on dozens of speeches and discussions from the "Ethereum Privacy Stack" event at Devconnect ARG 2025.
