Bitcoin Price Bounce at Risk: Is the Recovery About to Fade?

Bitcoin price started a recovery wave from the $55,600 zone. BTC is now struggling to clear the $58,500 resistance and might decline again.
- Bitcoin is struggling to recover above the $58,500 zone.
- The price is trading below $58,200 and the 100 hourly Simple moving average.
- There is a connecting bullish trend line forming with support at $57,250 on the hourly chart of the BTC/USD pair (data feed from Kraken).
- The pair could struggle to recover above the $58,500 or $58,750 resistance levels in the near term.
Bitcoin Price Faces Hurdles
Bitcoin price extended losses below the $57,200 support level. BTC even traded below the $57,000 support. A low was formed at $55,591 and the price recently started a recovery wave.
There was a move above the $56,500 and $57,000 resistance levels. It cleared the 50% Fib retracement level of the downward move from the $59,772 swing high to the $55,591 low. The price even cleared the $58,000 level but faced sellers near $58,500.
Bitcoin is now trading below $58,200 and the 100 hourly Simple moving average . There is also a connecting bullish trend line forming with support at $57,250 on the hourly chart of the BTC/USD pair.
On the upside, the price could face resistance near the $58,500 level. The first key resistance is near the $58,750 level or the 76.4% Fib retracement level of the downward move from the $59,772 swing high to the $55,591 low. A clear move above the $58,750 resistance might send the price further higher in the coming sessions.
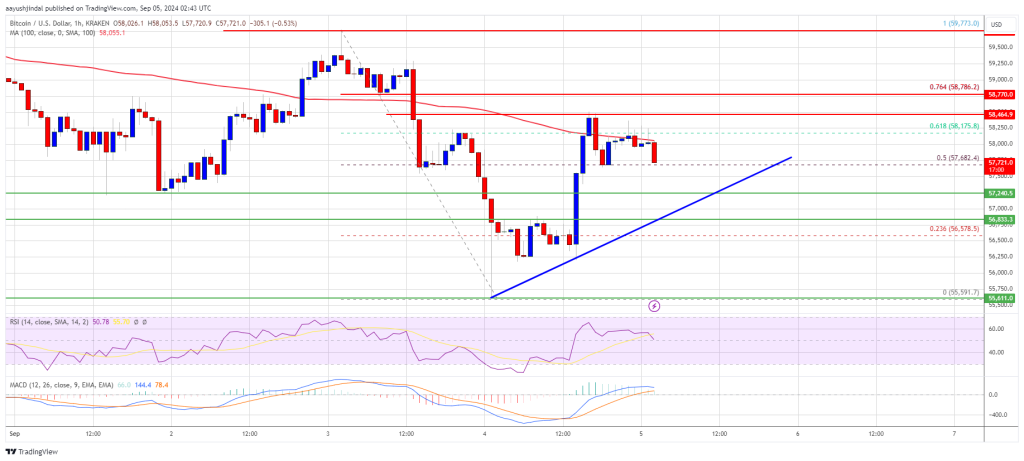
The next key resistance could be $59,500. A close above the $59,500 resistance might spark more upsides. In the stated case, the price could rise and test the $60,000 resistance.
Another Decline In BTC?
If Bitcoin fails to rise above the $58,500 resistance zone, it could start another decline. Immediate support on the downside is near the $57,250 level and the trend line.
The first major support is $56,850. The next support is now near the $56,200 zone. Any more losses might send the price toward the $55,500 support in the near term.
Technical indicators:
Hourly MACD – The MACD is now losing pace in the bullish zone.
Hourly RSI (Relative Strength Index) – The RSI for BTC/USD is now near the 50 level.
Major Support Levels – $57,250, followed by $56,850.
Major Resistance Levels – $58,500, and $58,750.
Disclaimer: The content of this article solely reflects the author's opinion and does not represent the platform in any capacity. This article is not intended to serve as a reference for making investment decisions.
You may also like
Bloomberg: As the crypto market crashes, the Trump family and its supporters are seeing their wealth shrink significantly
The Trump family's wealth has shrunk by $1 billion, making ordinary investors the biggest losers.

Why are most treasury DATs trading at a discount?
Is the DAT model truly a bridge connecting TradFi, or is it a “death spiral” for the crypto market?

Crypto giants speak out collectively—where is the market heading?

What kind of financial order game is hidden behind the stablecoin controversy?