
Stellar (XLM) Price Momentum Weakens Despite 459% Monthly Surge

Stellar’s 459% price rally faces headwinds as RSI neutrality and Ichimoku Cloud patterns suggest indecision. Resistance at $0.56 looms.
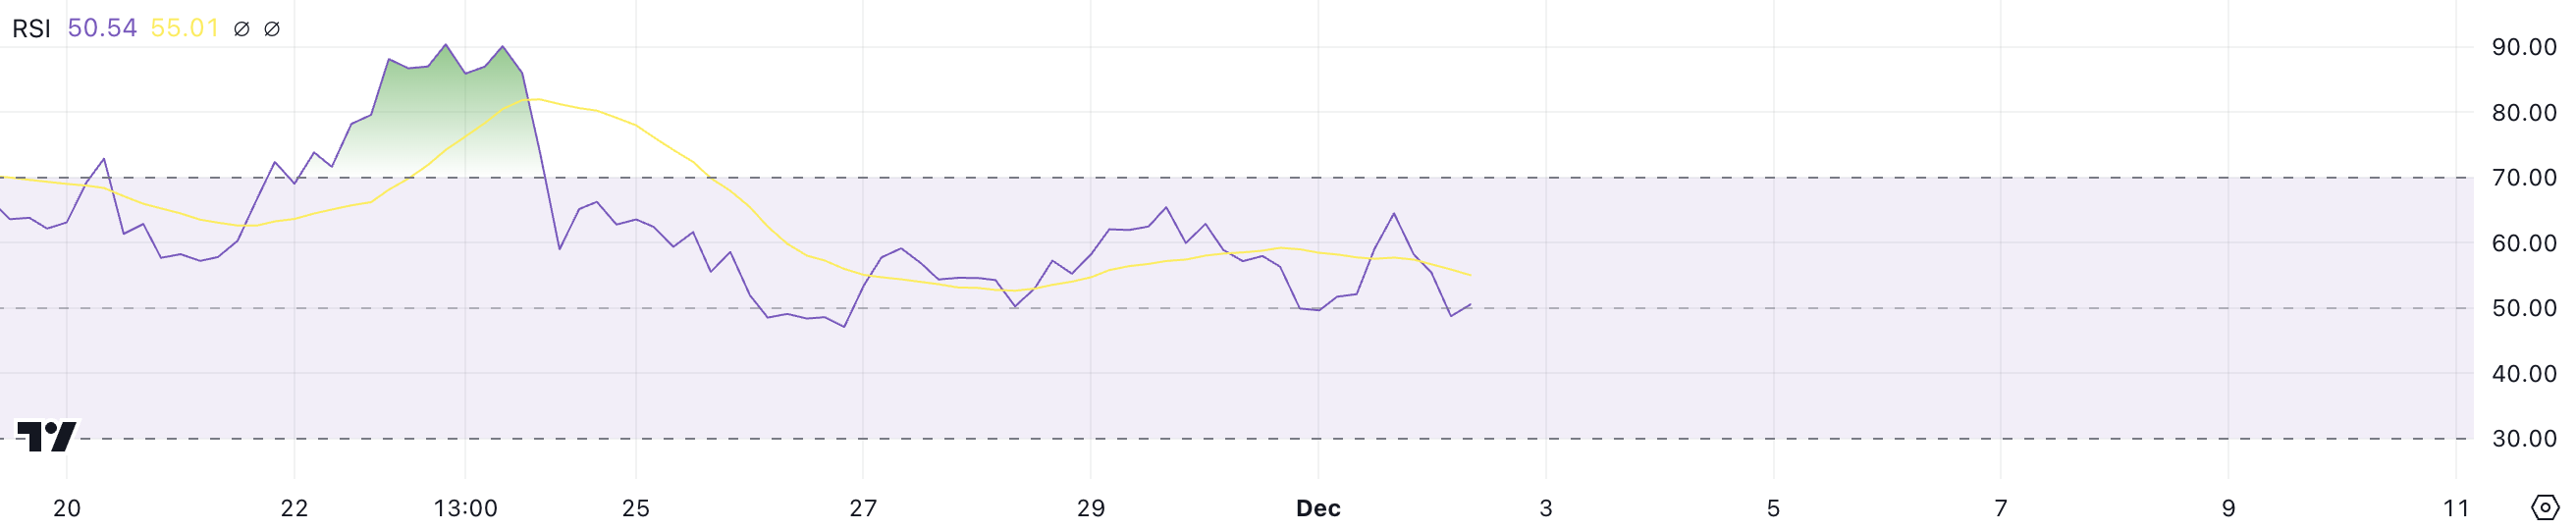
Stellar (XLM) price has skyrocketed 459% in the last 30 days, capturing significant market attention. Despite this rally, the RSI has cooled to 50.5, suggesting neutral momentum after a brief period of overbought conditions in late November.
Meanwhile, XLM faces key resistances at $0.53 and $0.56. Its EMA lines still show bullish patterns but hint at weakening short-term momentum. The Ichimoku Cloud suggests a potential shift in sentiment.
XLM RSI Is In the Neutral Zone
Stellar RSI currently sits at 50.5, dropping from 64 just a day earlier. Between November 21 and November 24, the RSI remained above 70, coinciding with XLM’s price reaching its highest level since May 2021.
This period of overbought conditions highlighted strong bullish momentum before the recent cooldown.
 XLM RSI. Source:
TradingView
XLM RSI. Source:
TradingView
The RSI, or Relative Strength Index, measures the speed and change of price movements, offering insight into whether an asset is overbought or oversold. RSI values above 70 typically indicate overbought conditions and the potential for a pullback, while values below 30 suggest oversold conditions and possible price recovery.
With XLM RSI now at 50.5, it reflects a more neutral stance, indicating a balance between buying and selling pressure. This could mean the price is consolidating, awaiting further market cues to define its next move.
Stellar Ichimoku Cloud Shows the Current Sentiment Could Be Shifting
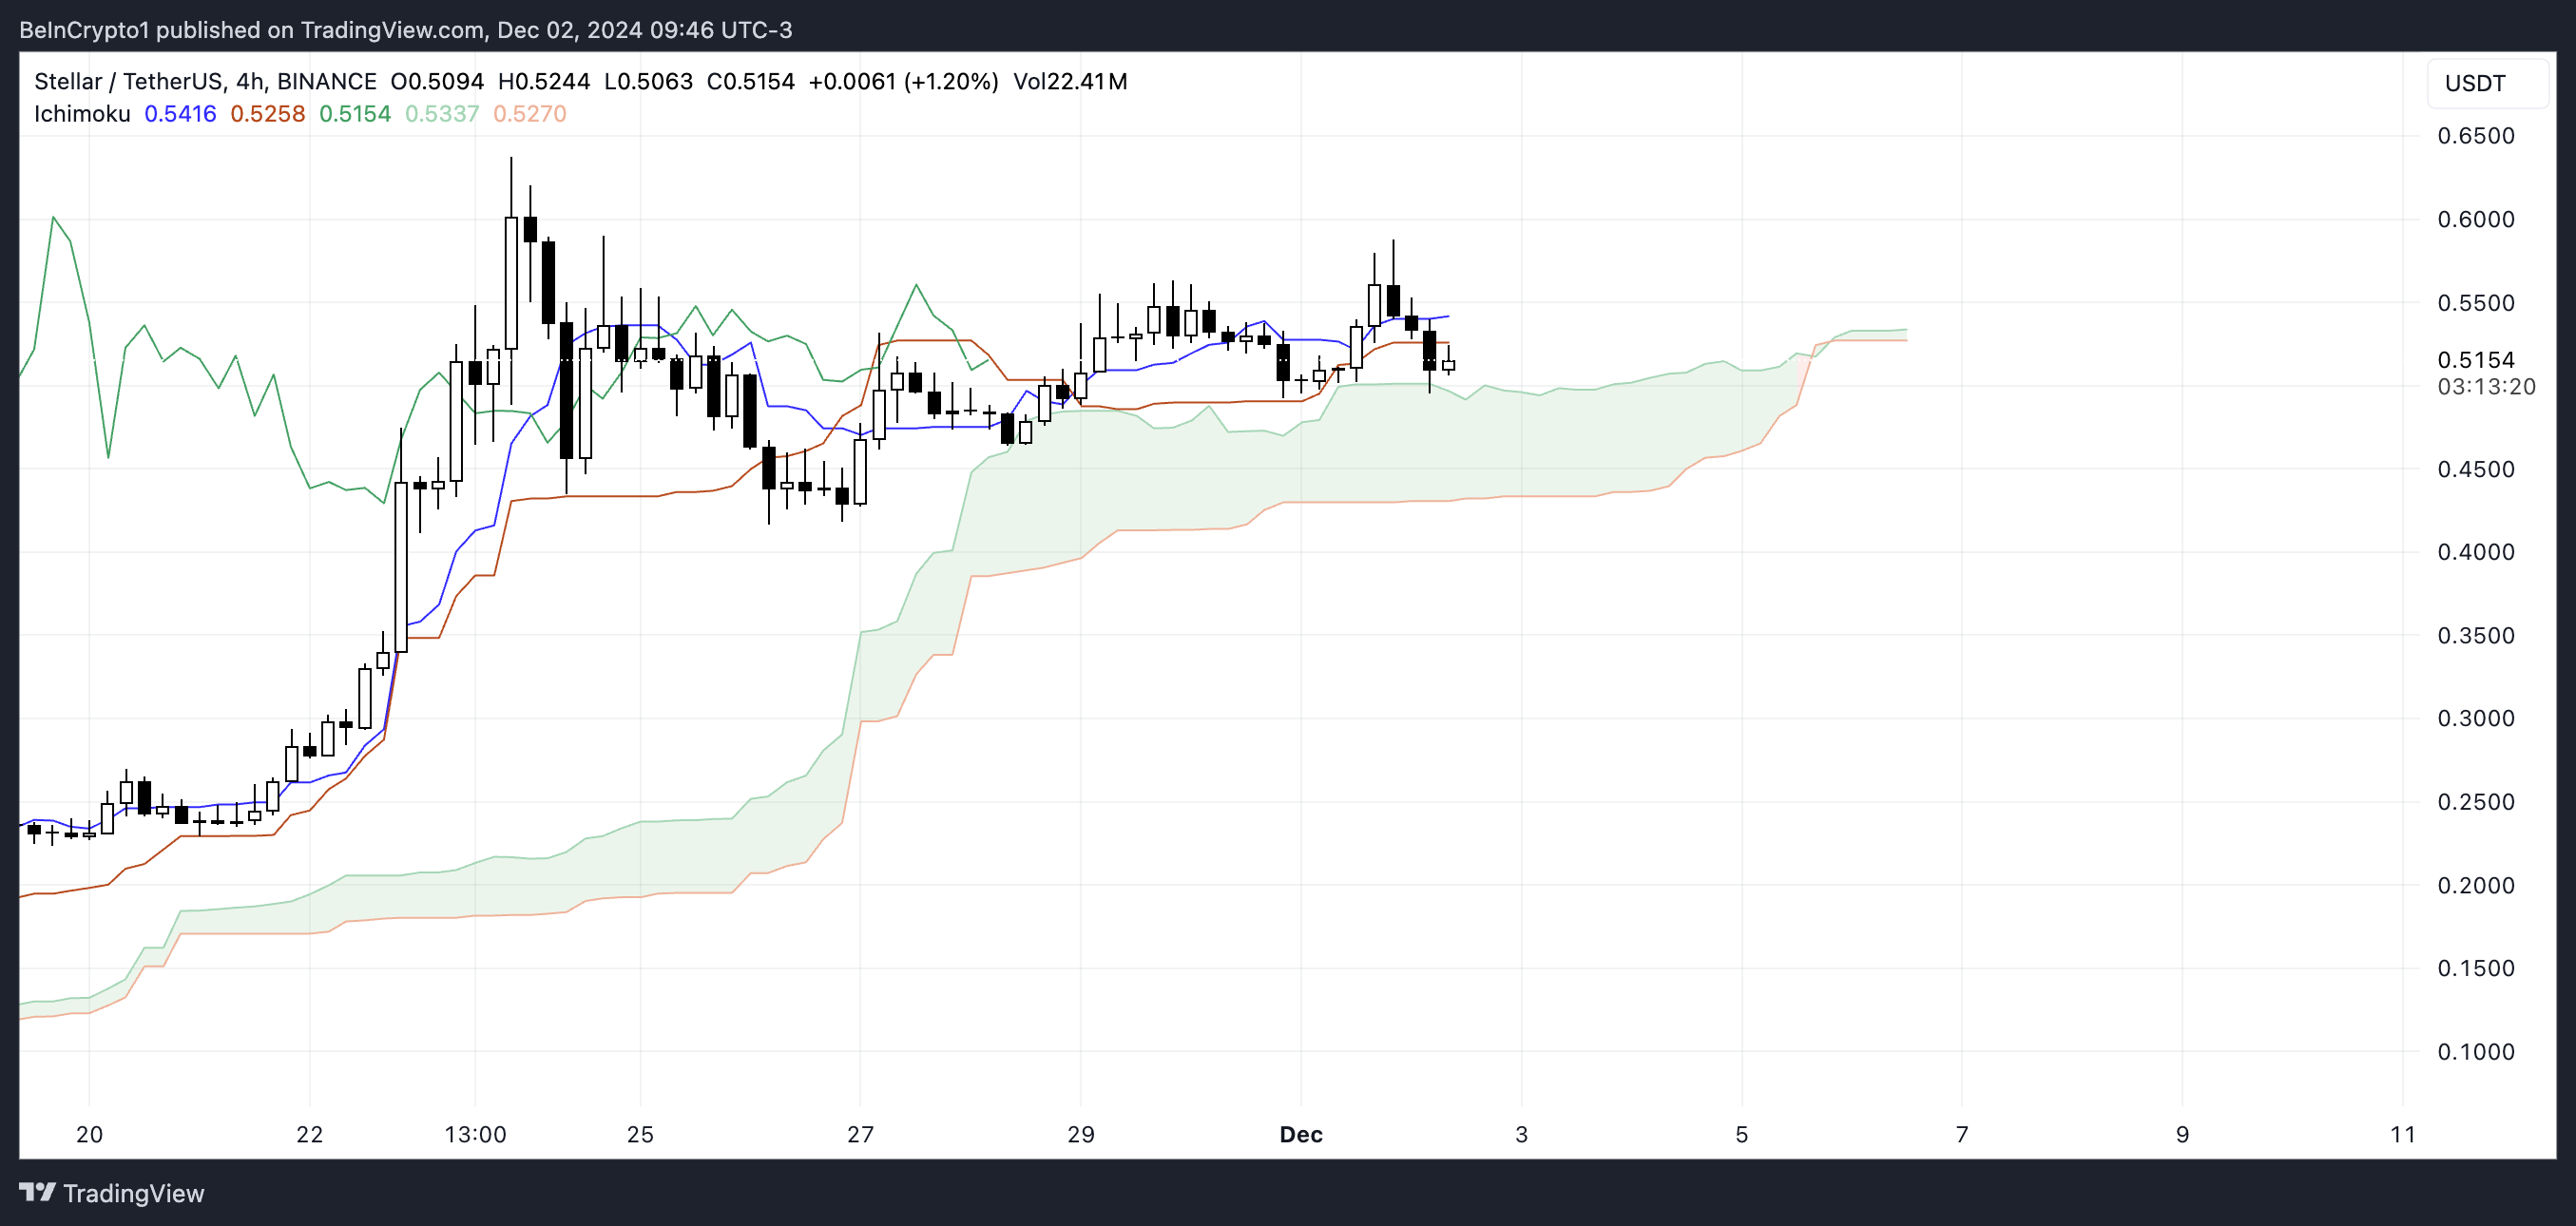
This Ichimoku Cloud chart for Stellar shows price action currently positioned near the cloud, indicating a potential test of support.
The leading span (green and red shaded area) reflects a neutral to slightly bullish trend. The cloud is relatively flat but still offers support around the $0.50 level. The Tenkan-sen (blue line) is below the Kijun-sen (red line), suggesting short-term weakness in momentum.
 XLM Ichimoku Cloud. Source:
TradingView
XLM Ichimoku Cloud. Source:
TradingView
If XLM remains above the cloud, the overall trend can stay bullish, with potential for recovery toward the Tenkan-sen and Kijun-sen levels.
However, a breakdown below the cloud could signal a bearish shift, with price likely retesting lower support zones. The cloud’s flat nature suggests indecision in the market, so traders may look for a breakout or breakdown as the next clear signal.
XLM Price Prediction: Can It Reach $0.7 In December?
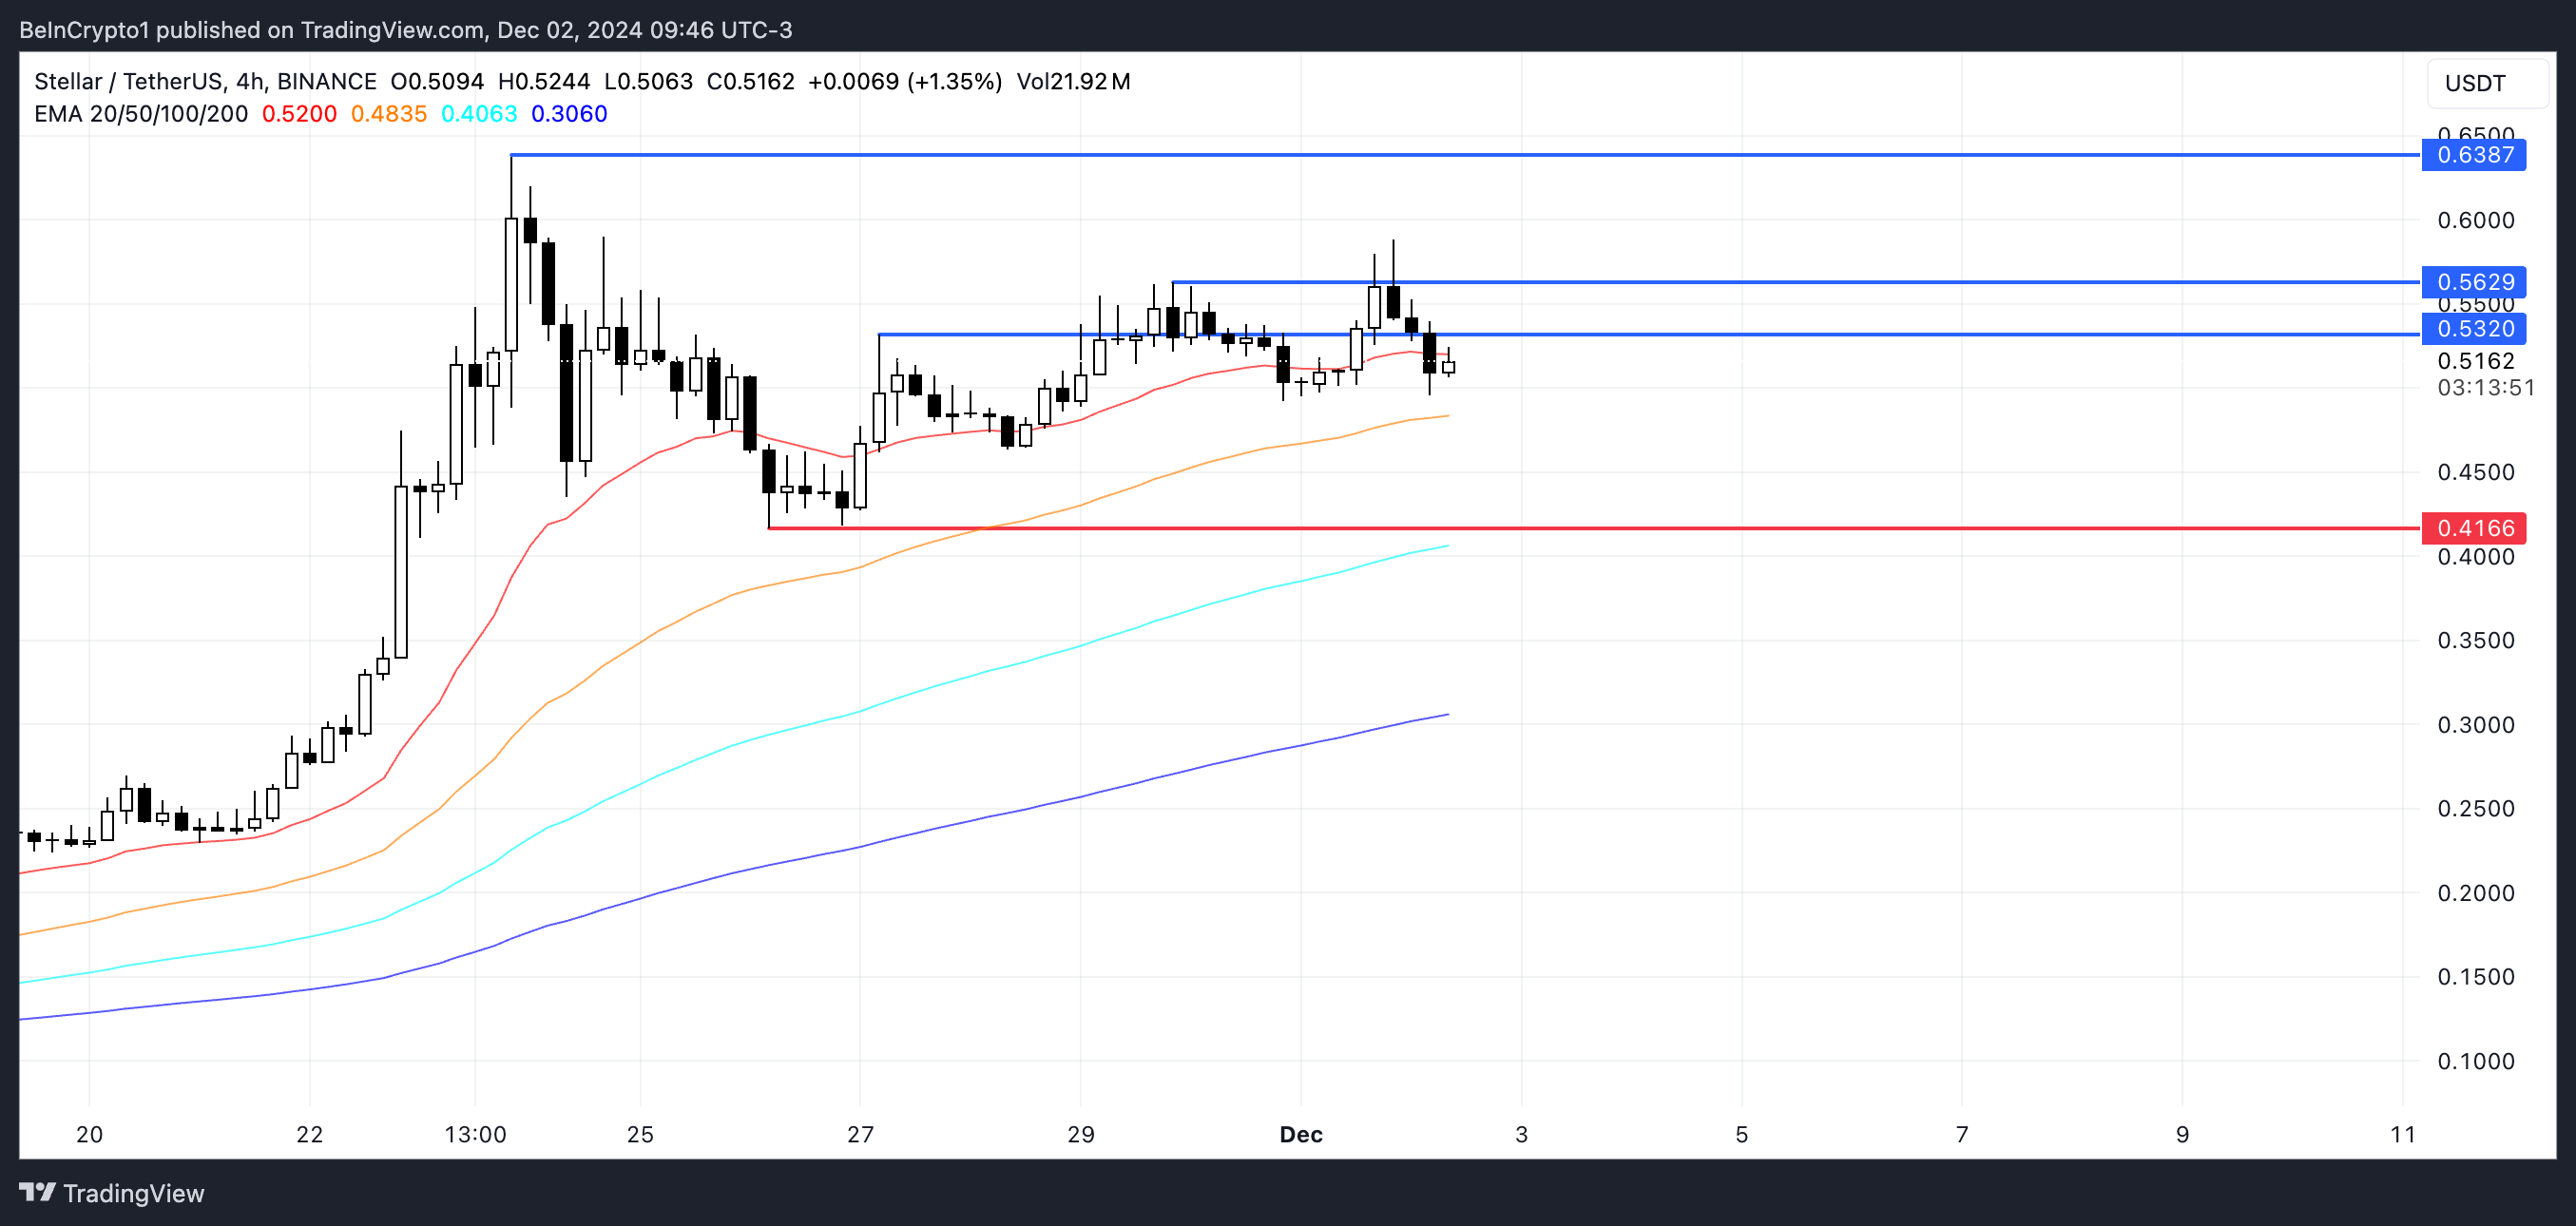
XLM currently faces two nearby resistances at $0.53 and $0.56, while its EMA lines remain bullish, with short-term averages above long-term ones.
However, Stellar price has recently dropped below the shortest-term EMA, signaling a potential loss of short-term momentum. This suggests that the ongoing uptrend is weakening, and without a quick recovery, further downside could follow.
 XLM Price Analysis. Source:
TradingView
XLM Price Analysis. Source:
TradingView
If the uptrend regains strength and XLM price breaks through these resistances, it could retest $0.638, with the potential to climb toward $0.65 or even $0.7, revisiting price levels last seen in 2021.
On the other hand, the Ichimoku Cloud and EMA patterns show signs of a possible trend reversal. If this bearish shift materializes, XLM price might test support near $0.41, marking a significant correction from current levels.
Disclaimer: The content of this article solely reflects the author's opinion and does not represent the platform in any capacity. This article is not intended to serve as a reference for making investment decisions.
You may also like
Infighting, scandals, and a stock price plunge: What can DAT rely on to survive?

Price predictions 11/28: BTC, ETH, XRP, BNB, SOL, DOGE, ADA, HYPE, BCH, LINK

Ethereum Privacy’s HTTPS Moment: From Defensive Tool to Default Infrastructure
A summary of the "Holistic Reconstruction of Privacy Paradigms" based on dozens of speeches and discussions from the "Ethereum Privacy Stack" event at Devconnect ARG 2025.
