
Travala (AVA) Price Struggles to Sustain Momentum After Record Rally

AVA price skyrockets 300%, fueled by Binance’s endorsement and revenue growth. Cooling momentum hints at consolidation or reversal.
Travala (AVA) price has surged 300% recently, following Binance CEO CZ’s revelation of Binance’s early investment in the platform. This announcement, coupled with the company reporting $100 million in annual revenue, has fueled significant market interest in AVA.
However, as momentum indicators show signs of cooling, the asset has entered a pivotal phase, balancing between further gains and potential corrections.
AVA Is Now In The Neutral Zone
AVA’s Relative Strength Index (RSI) recently surged to 96, staying above 70 from December 12 to December 13, signaling extremely overbought conditions driven by strong bullish momentum. Now, the RSI has dropped to 47.8, reflecting a significant cooldown in buying pressure.
RSI, a momentum indicator measuring price changes on a scale of 0 to 100, indicates overbought conditions above 70 and oversold conditions below 30. AVA’s transition from an overbought zone to a neutral level suggests a shift in market sentiment.
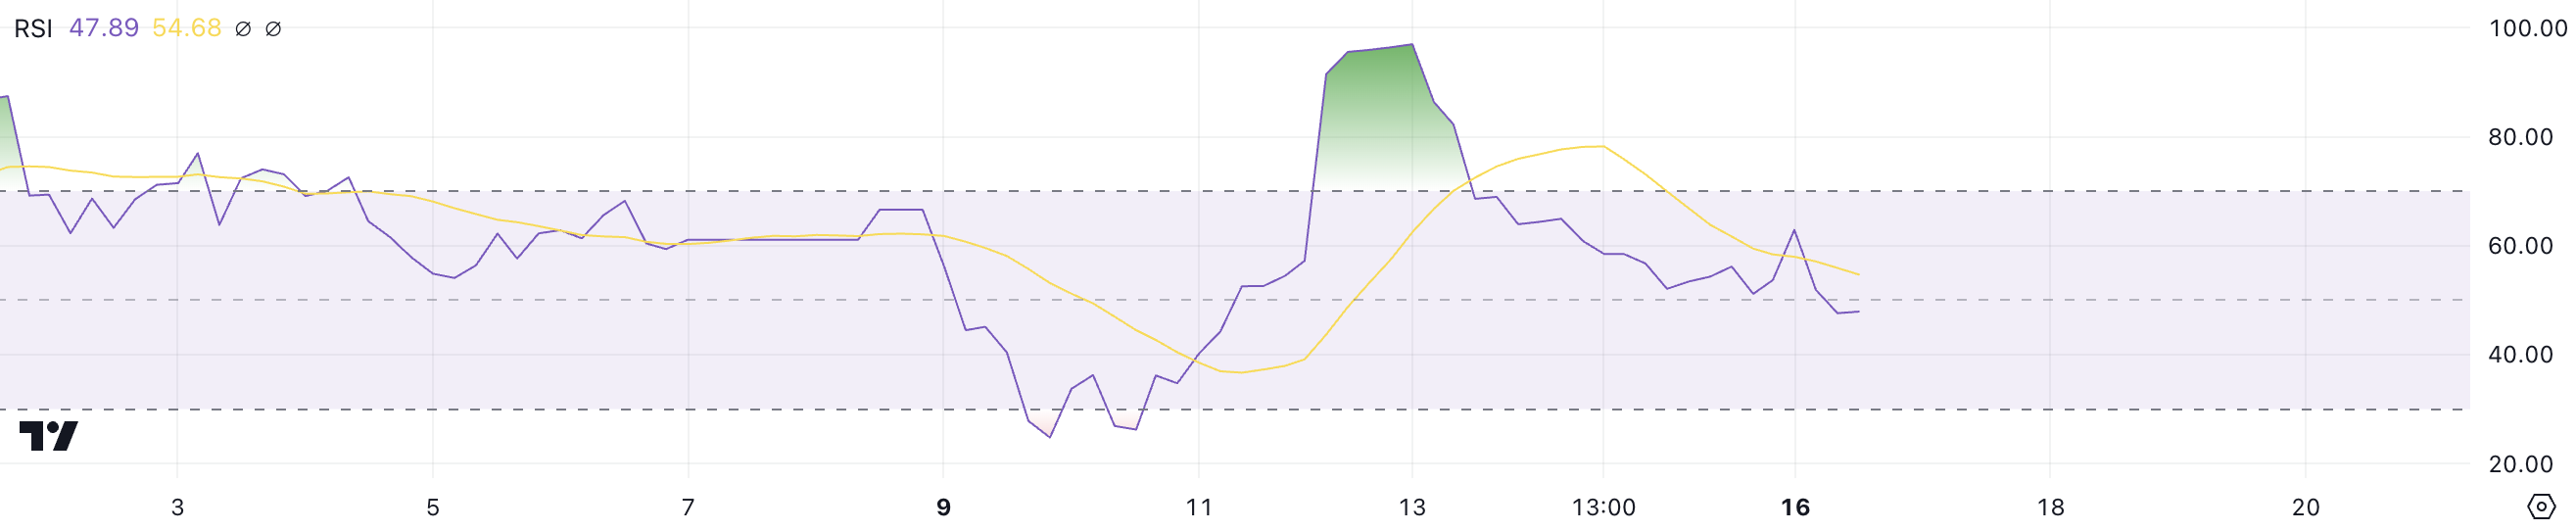 AVA RSI. Source:
TradingView
AVA RSI. Source:
TradingView
With the RSI at 47.8, AVA price is now in neutral territory, indicating that the prior surge has subsided, and the asset is neither overbought nor oversold. This drop from 96 highlights a loss of momentum, suggesting that the price may stabilize or face further consolidation.
While the current RSI leaves room for a renewed uptrend, traders should also be cautious of potential downside risks as AVA’s bullish momentum continues to wane.
Travala Current Trend Is Losing Its Strength
Travala Average Directional Index (ADX) is currently at 39.5, down from 57 just three days ago. The ADX measures the strength of a trend, with values above 25 indicating a strong trend and those below 20 suggesting a weak or directionless market.
While an ADX of 39.5 still reflects a strong trend, the notable decline from its recent high signals a weakening of momentum, raising the possibility of an upcoming shift in the market.
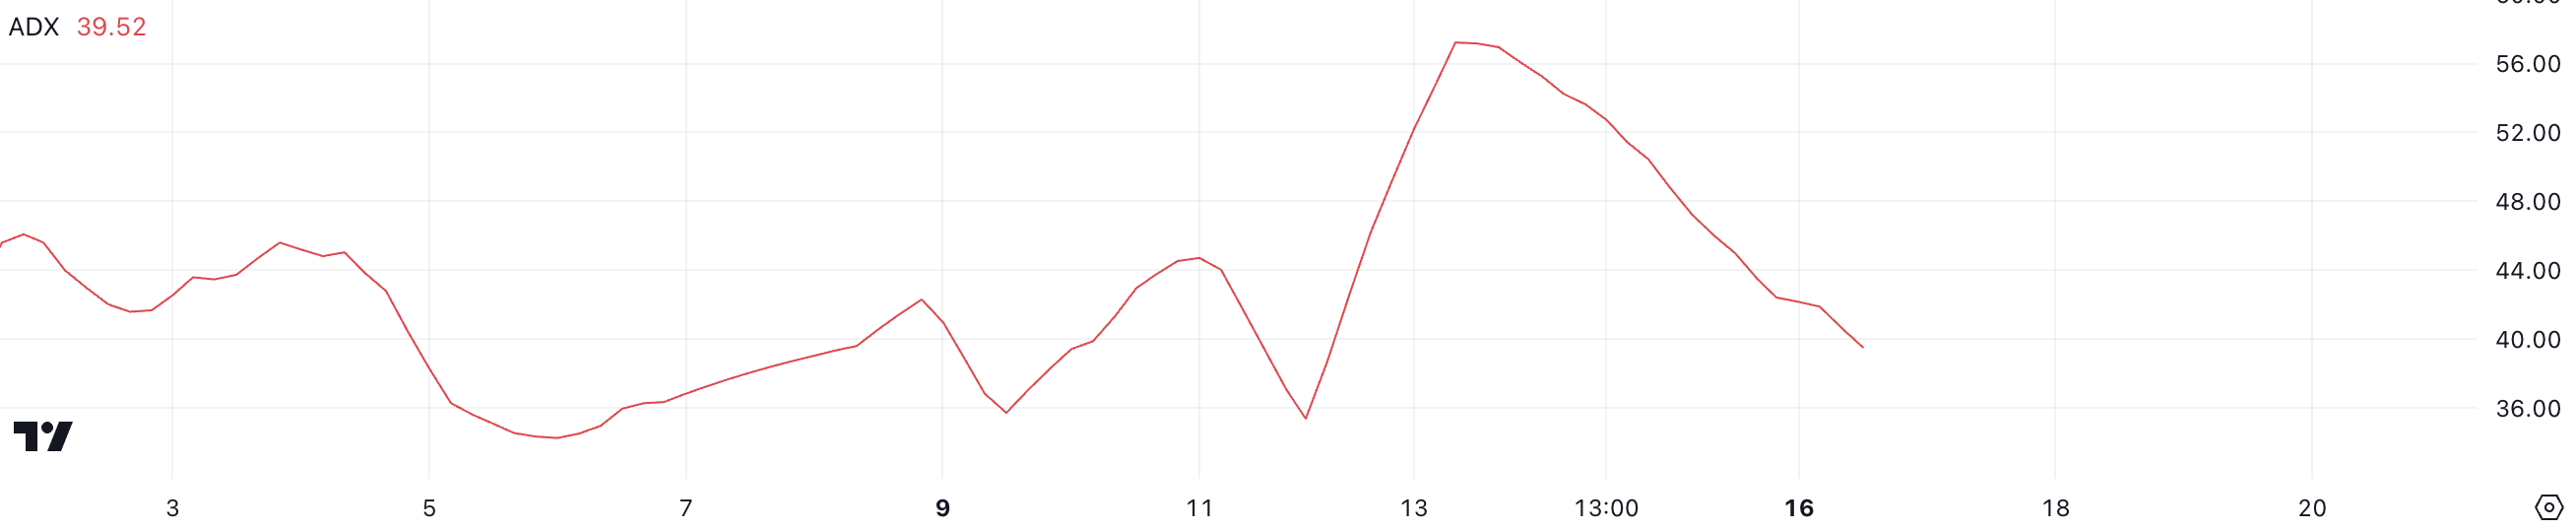 AVA ADX. Source:
TradingView
AVA ADX. Source:
TradingView
Despite the ADX decline, AVA lines still show an uptrend, indicating that the bullish trend is intact for now. However, the dropping ADX suggests it may be challenging for a new strong uptrend to emerge, as the trend strength is gradually fading.
Traders should remain cautious, as the weakening ADX could signal an impending consolidation or a potential reversal in price action if buying pressure continues to decrease.
AVA Price Prediction: Will It Reach $3.5 Before Christmas?
AVA price analysis chart shows that its short-term EMA lines remain above long-term ones, maintaining a bullish setup. However, the downward slope of the shortest EMA line suggests the uptrend could be losing strength.
If the bearish momentum continues, AVA price might test the strong support at $1.56. If this level fails, the price could decline further, potentially dropping by almost 50% to $0.81 or even $0.62.
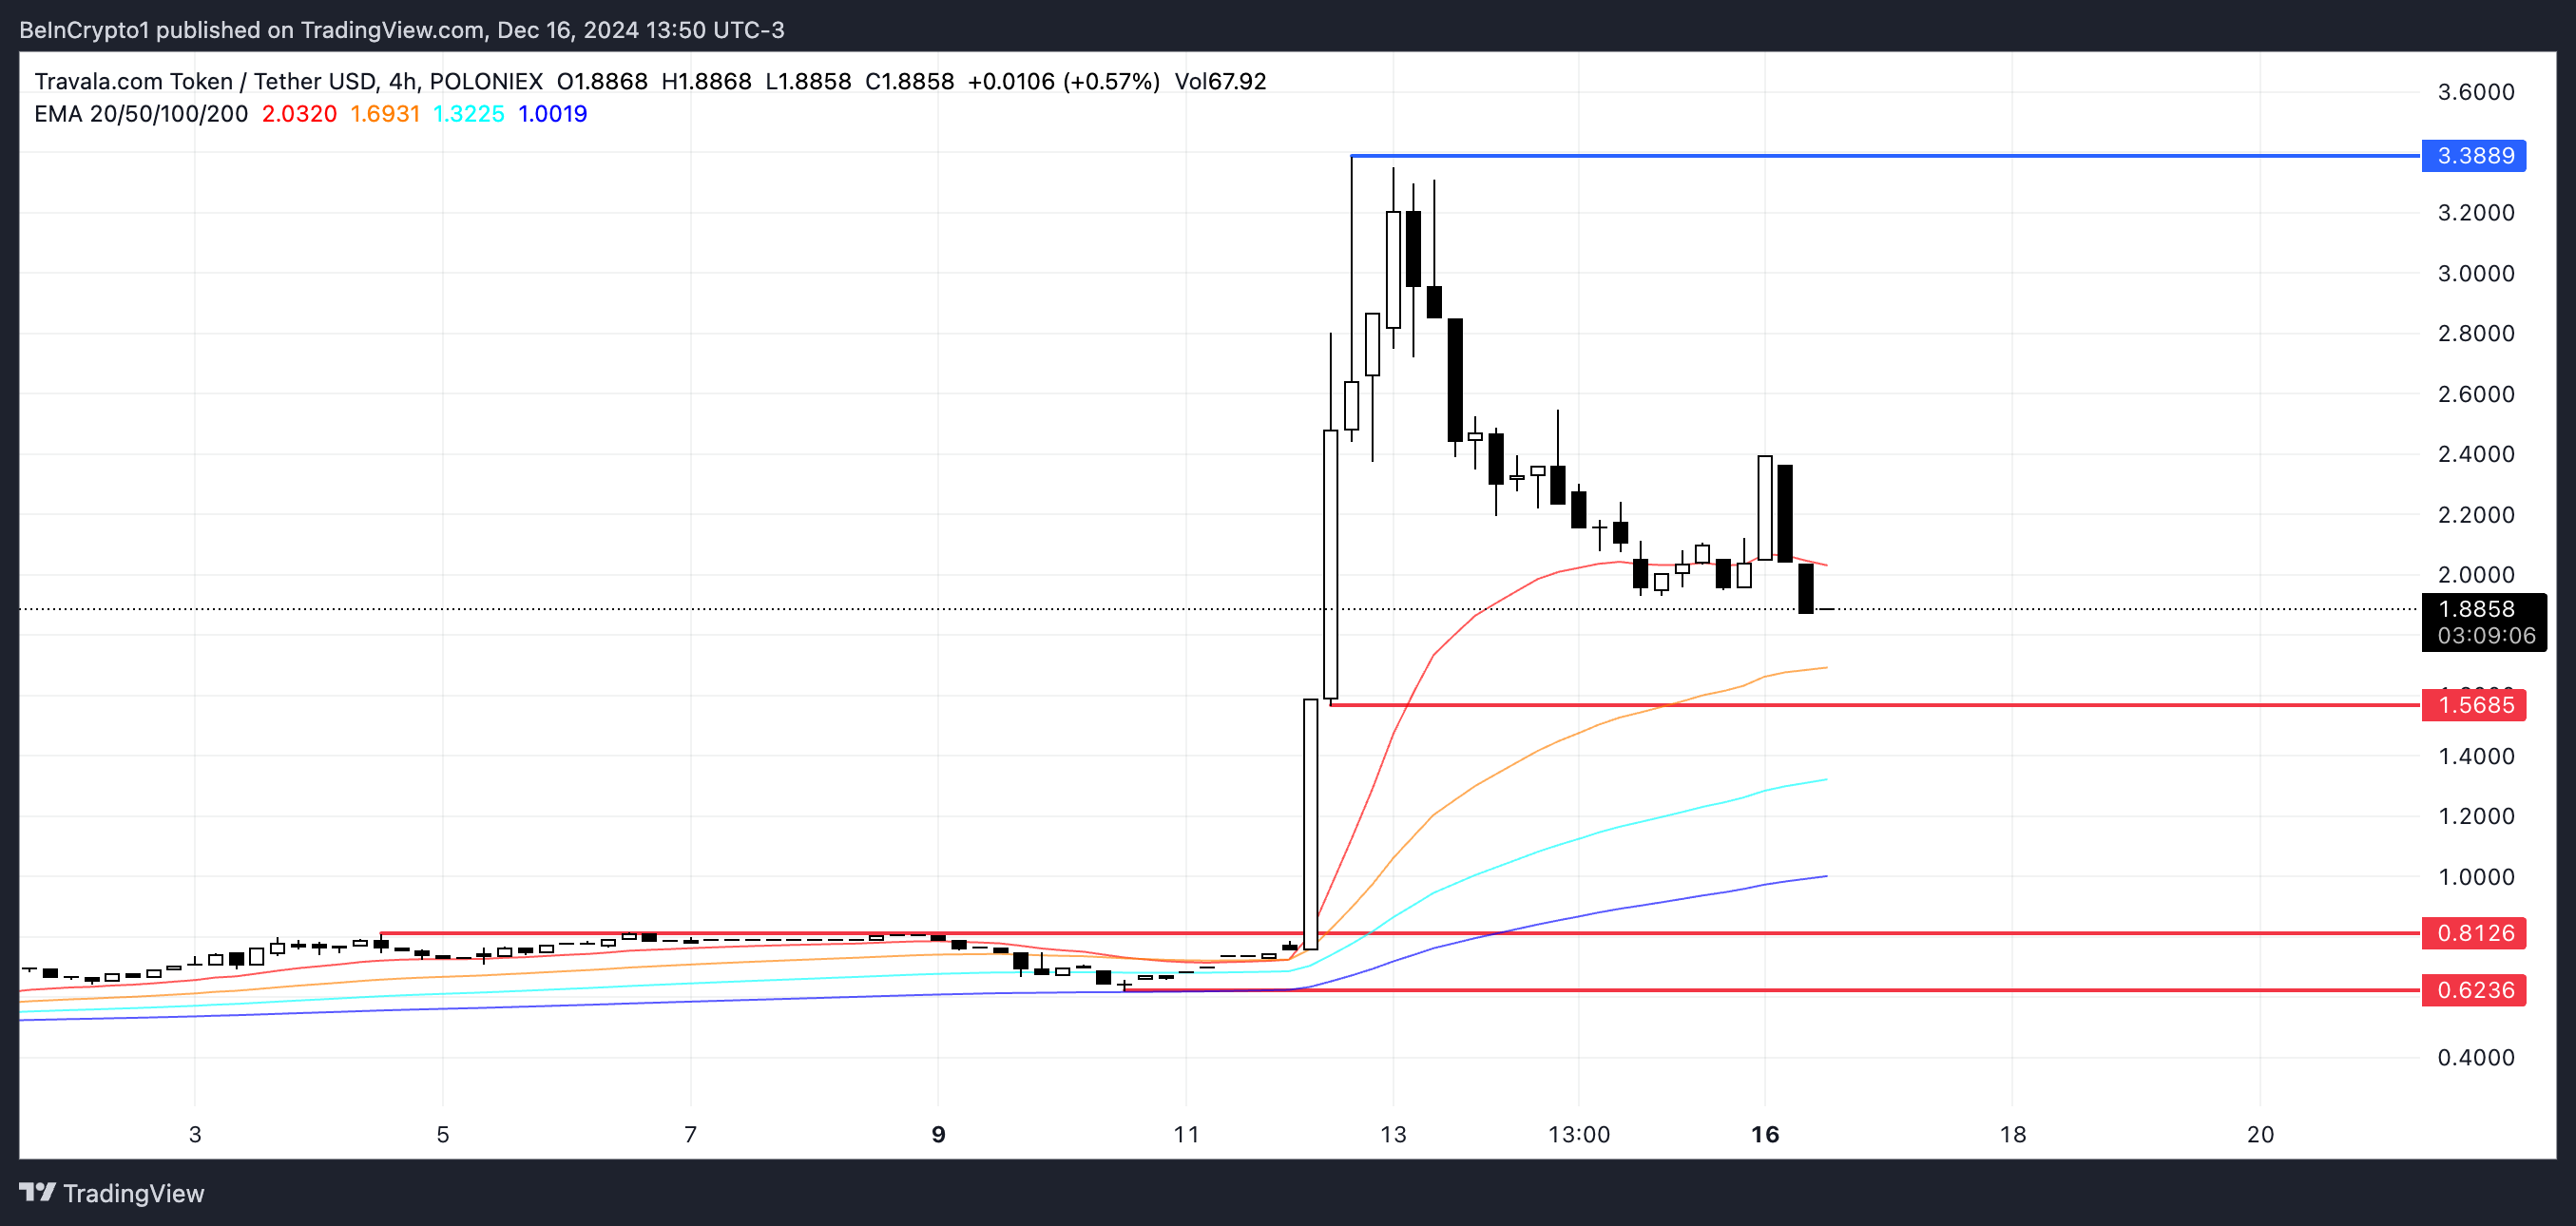 AVA Price Analysis. Source:
TradingView
AVA Price Analysis. Source:
TradingView
On the other hand, if the uptrend regains momentum, AVA price could rebound and retest the $3.38 resistance level, with the possibility of reaching $3.50 next, remaining as one of the best-performing coins of the last week.
The EMA lines highlight a pivotal moment for AVA, with the next moves likely depending on whether a bullish recovery outweighs the current fading trend signals.
Disclaimer: The content of this article solely reflects the author's opinion and does not represent the platform in any capacity. This article is not intended to serve as a reference for making investment decisions.
You may also like
LITUSDT now launched for futures trading and trading bots
Bitget Spot Margin Announcement on Suspension of CELR/USDT, RIF/USDT Margin Trading Services
CandyBomb x FOGO: Trade futures to share 1,000,000 FOGO!
Bitget Spot Cross Margin adds HYPE/USDT