XRP Price Shows Resilience While BTC Sinks Deeper

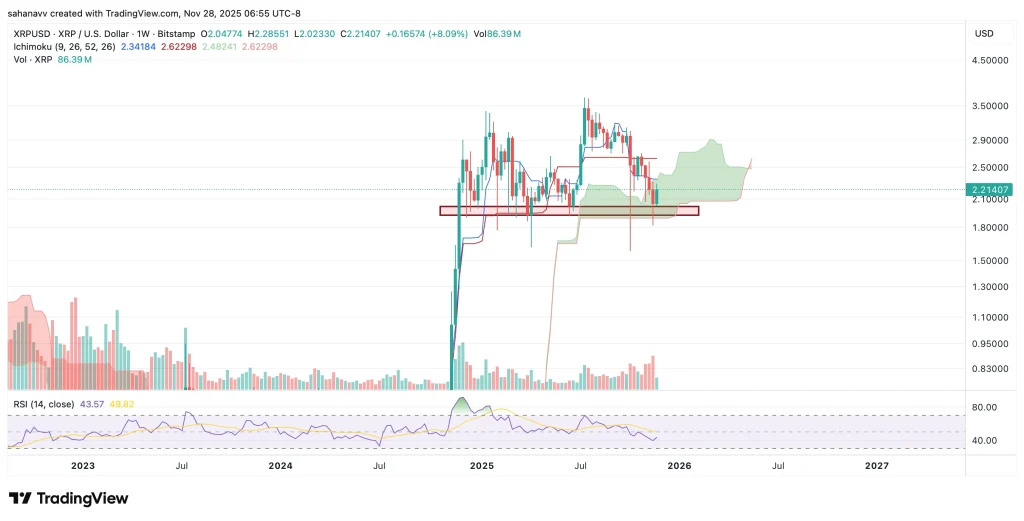
XRP price remained stable above the $2.20 support zone. The price is consolidating and might aim for a fresh increase above the $2.40 resistance.
- XRP price remained stable above the $2.20 zone.
- The price is now trading below $2.40 and the 100-hourly Simple Moving Average.
- There is a connecting bearish trend line forming with resistance at $2.35 on the hourly chart of the XRP/USD pair (data source from Kraken).
- The pair might start another increase if it clears the $2.40 resistance.
XRP Price Stays Above $2.20
XRP price remained well-bid above the $2.20 support level, unlike Bitcoin and Ethereum . A low was formed at $2.17 and the price traded in a range below the $2.40 level.
There was a minor increase above the $2.25 and $2.30 levels. The price climbed above the 23.6% Fib retracement level of the downward move from the $2.720 swing high to the $2.171 low. The price is now trading below $2.40 and the 100-hourly Simple Moving Average.
On the upside, the price might face resistance near the $2.35 level. There is also a connecting bearish trend line forming with resistance at $2.35 on the hourly chart of the XRP/USD pair.
Source: XRPUSD on TradingView.comThe first major resistance is near the $2.40 level. The next resistance is $2.45 or the 50% Fib retracement level of the downward move from the $2.720 swing high to the $2.171 low. A clear move above the $2.45 resistance might send the price toward the $2.50 resistance. Any more gains might send the price toward the $2.550 resistance or even $2.620 in the near term. The next major hurdle for the bulls might be $2.80.
Are Dips Limited?
If XRP fails to clear the $2.40 resistance zone, it could start another decline. Initial support on the downside is near the $2.25 level. The next major support is near the $2.20 level.
If there is a downside break and a close below the $2.20 level, the price might continue to decline toward the $2.050 support. The next major support sits near the $2.00 zone.
Technical Indicators
Hourly MACD – The MACD for XRP/USD is now losing pace in the bearish zone.
Hourly RSI (Relative Strength Index) – The RSI for XRP/USD is now below the 50 level.
Major Support Levels – $2.20 and $2.050.
Major Resistance Levels – $2.35 and $2.40.
Disclaimer: The content of this article solely reflects the author's opinion and does not represent the platform in any capacity. This article is not intended to serve as a reference for making investment decisions.
You may also like
HYPE Price Prediction December 2025: Can Hyperliquid Absorb Its Largest Supply Shock?
XRP Price Stuck Below Key Resistance, While Hidden Bullish Structure Hints at a Move To $3
Bitcoin Price Prediction: Recovery Targets $92K–$101K as Market Stabilizes
Ethereum’s Layer‑2 Surge Signals Next ETH Price Rally—But a Key Hurdle Remains