
Shiba Inu (SHIB) Eyes Recovery: 2 Indicators Suggest Upward Momentum Ahead

Shiba Inu’s price consolidates as bullish indicators emerge. Will SHIB break key resistance and launch a new rally? Explore the outlook.
Shiba Inu (SHIB) has been consolidating over the past two weeks, struggling to break out and recover from recent losses.
Despite this stagnation, the changing momentum suggests the meme coin could soon regain upward traction. Indicators point toward an impending shift, fueling optimism among investors.
Shiba Inu Investors Have An Opportunity
Shiba Inu’s Market Value to Realized Value (MVRV) ratio has dipped into the opportunity zone, which lies between -9% and -21%. Historically, this zone signals potential price reversals, as it often prompts investors to hold their positions rather than sell. This behavior supports accumulation at lower price levels, reducing selling pressure.
Every time the MVRV ratio has entered this zone, SHIB has shown a tendency to bounce back. Current market conditions align with this pattern, encouraging investors to anticipate a recovery. This trend highlights the growing confidence that SHIB could soon break free from its consolidation phase.
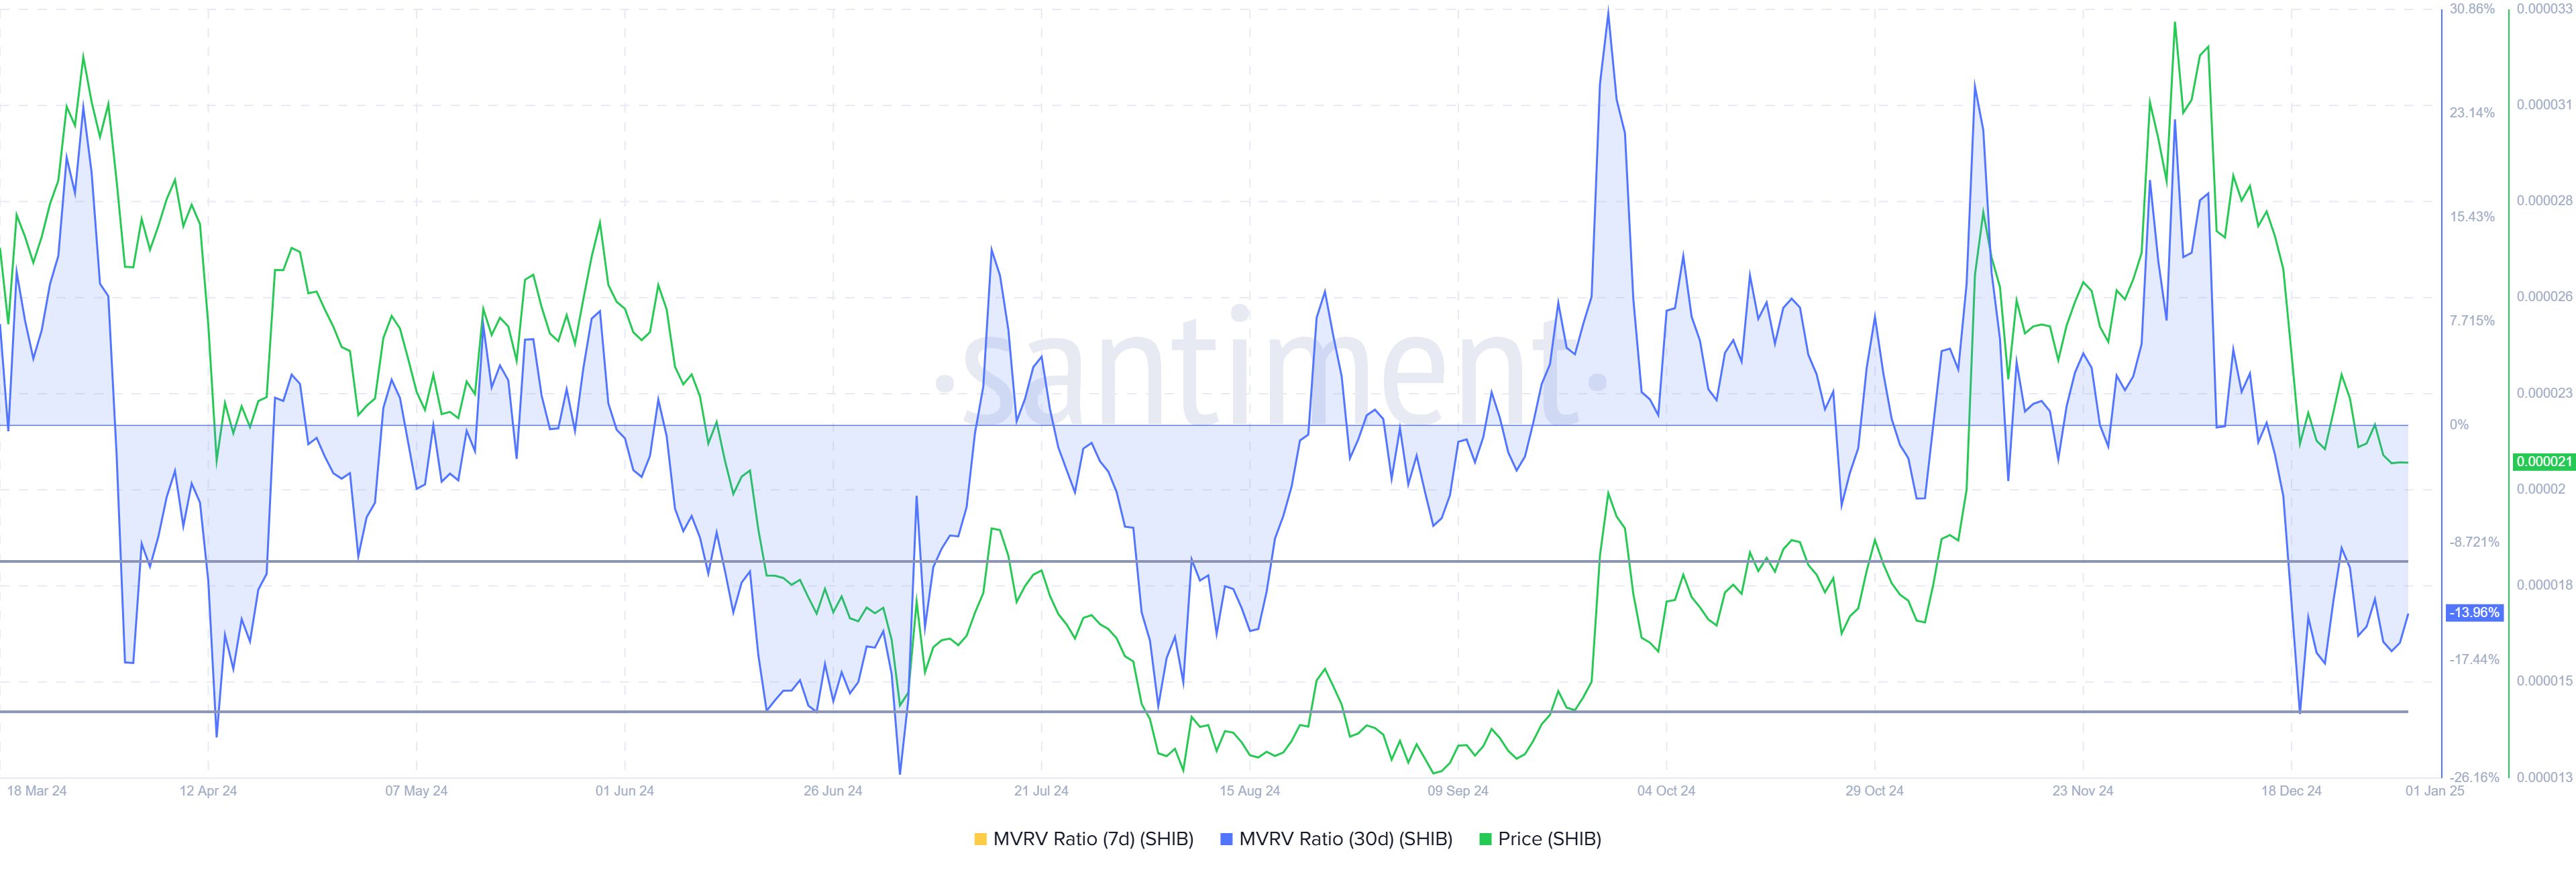 Shiba Inu MVRV Ratio. Source:
Santiment
Shiba Inu MVRV Ratio. Source:
Santiment
The Moving Average Convergence Divergence (MACD) indicator for SHIB suggests that bearish momentum is fading. The MACD is nearing a bullish crossover, indicating a potential shift from negative to positive momentum. This technical signal has historically aligned with upward price movements, signaling a possible recovery for the cryptocurrency.
As the bearish pressure subsides, SHIB is poised to attract renewed buying interest. A confirmed bullish crossover on the MACD would strengthen the case for a sustained rally. This shift in momentum could enable Shiba Inu to regain lost ground and target higher resistance levels.
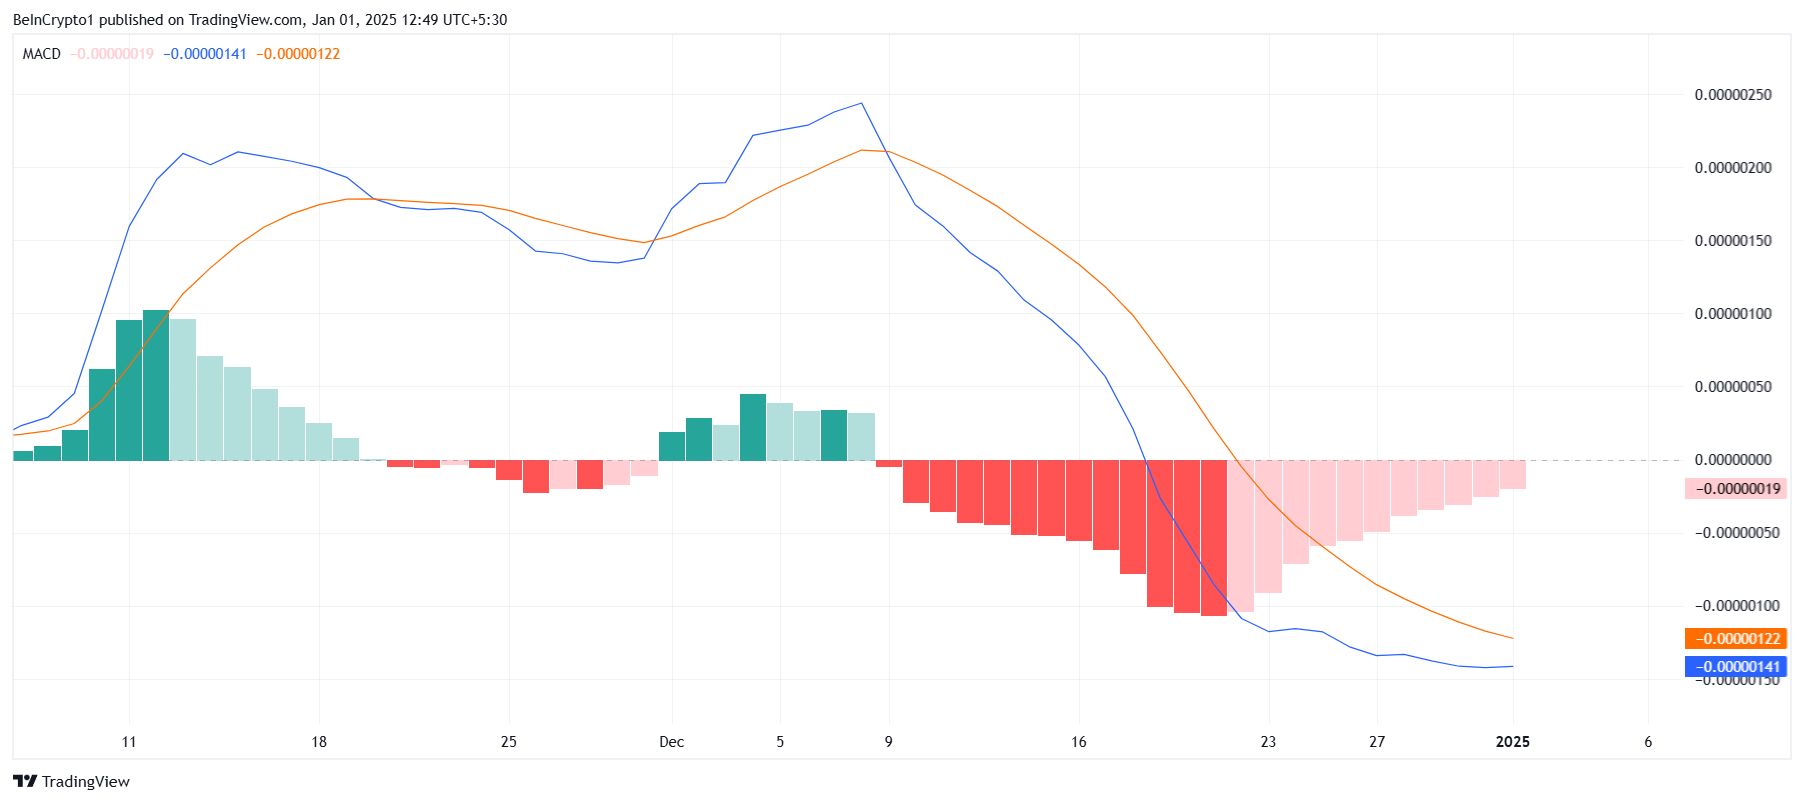 Shiba Inu MACD. Source:
TradingView
Shiba Inu MACD. Source:
TradingView
SHIB Price Prediction: Breaking Out Is The Target
Shiba Inu’s price has been trading between $0.00002341 and $0.00002093 over the past two weeks, currently hovering at $0.00002118. Considering the improving indicators, a drop below this range appears unlikely. Accumulation and reduced selling pressure are expected to support the current levels.
For SHIB to recover, it must flip $0.00002341 into support and break past $0.00002606, a key resistance level. Historically, the meme coin has consolidated under this level, making it a critical target. Achieving this milestone would signal the beginning of a new rally.
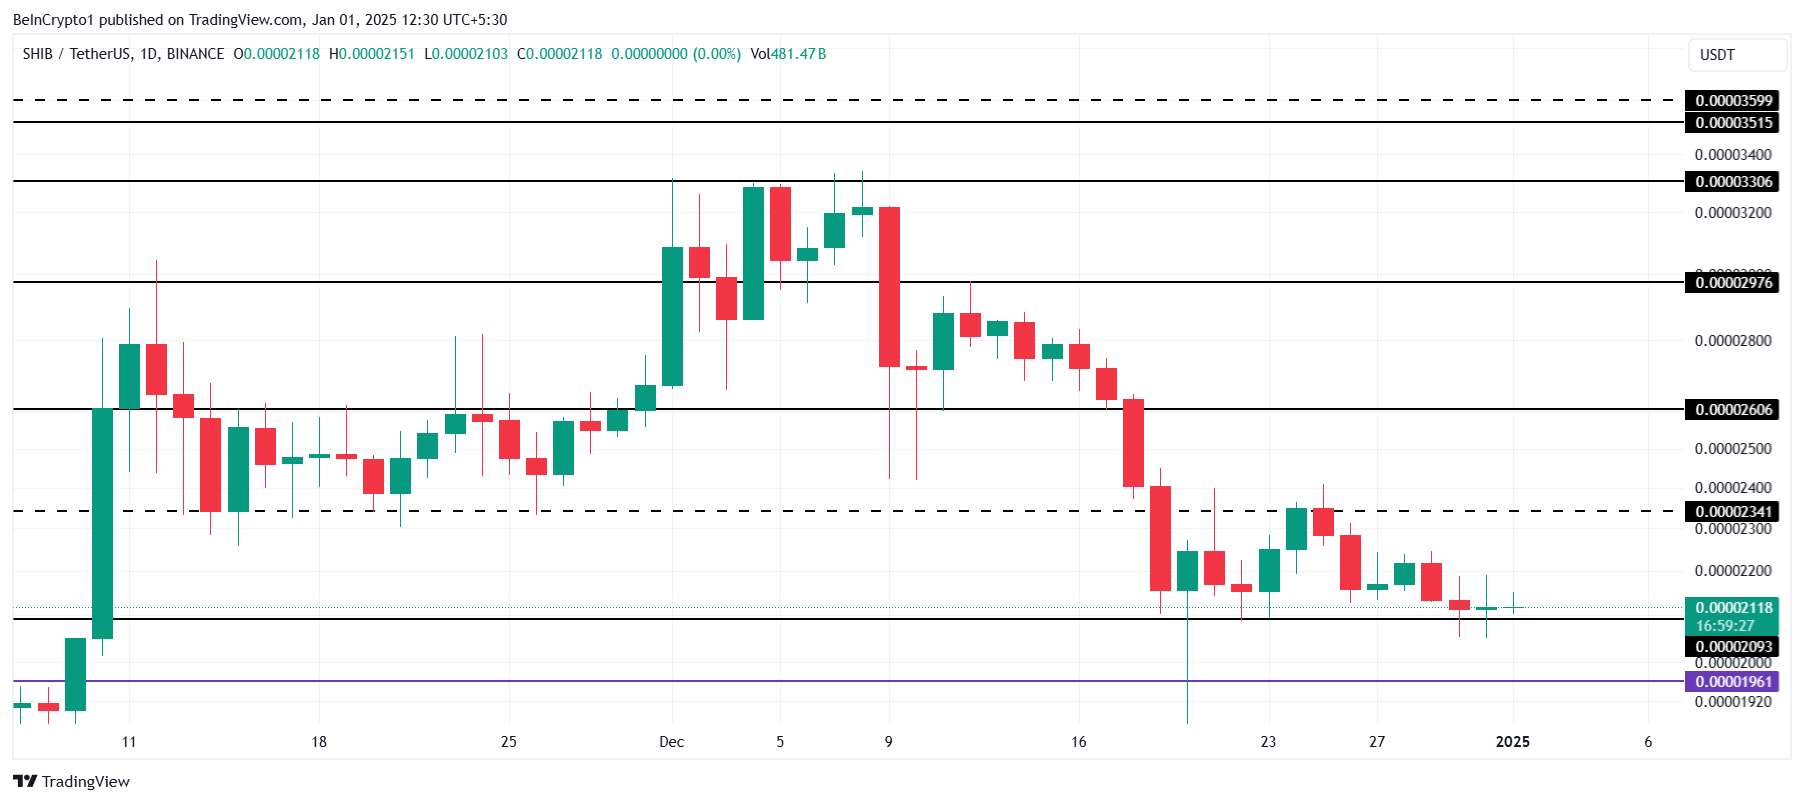 Shiba Inu Price Analysis. Source:
TradingView
Shiba Inu Price Analysis. Source:
TradingView
However, if bearish momentum persists, SHIB’s price could drop to $0.00001961. This scenario would invalidate the bullish outlook and raise caution among investors. Maintaining key support levels is vital to sustaining market optimism.
Disclaimer: The content of this article solely reflects the author's opinion and does not represent the platform in any capacity. This article is not intended to serve as a reference for making investment decisions.
You may also like
A decade-long tug-of-war ends: "Crypto Market Structure Bill" sprints to the Senate
At the Blockchain Association Policy Summit, U.S. Senators Gillibrand and Lummis stated that the "Crypto Market Structure Bill" is expected to have its draft released by the end of this week, with revisions and hearings scheduled for next week. The bill aims to establish clear boundaries for digital assets by adopting a classification-based regulatory framework, clearly distinguishing between digital commodities and digital securities, and providing a pathway for exemptions for mature blockchains to ensure that regulation does not stifle technological progress. The bill also requires digital commodity trading platforms to register with the CFTC and establishes a joint advisory committee to prevent regulatory gaps or overlapping oversight. Summary generated by Mars AI. The accuracy and completeness of this summary, generated by the Mars AI model, is still being iteratively updated.
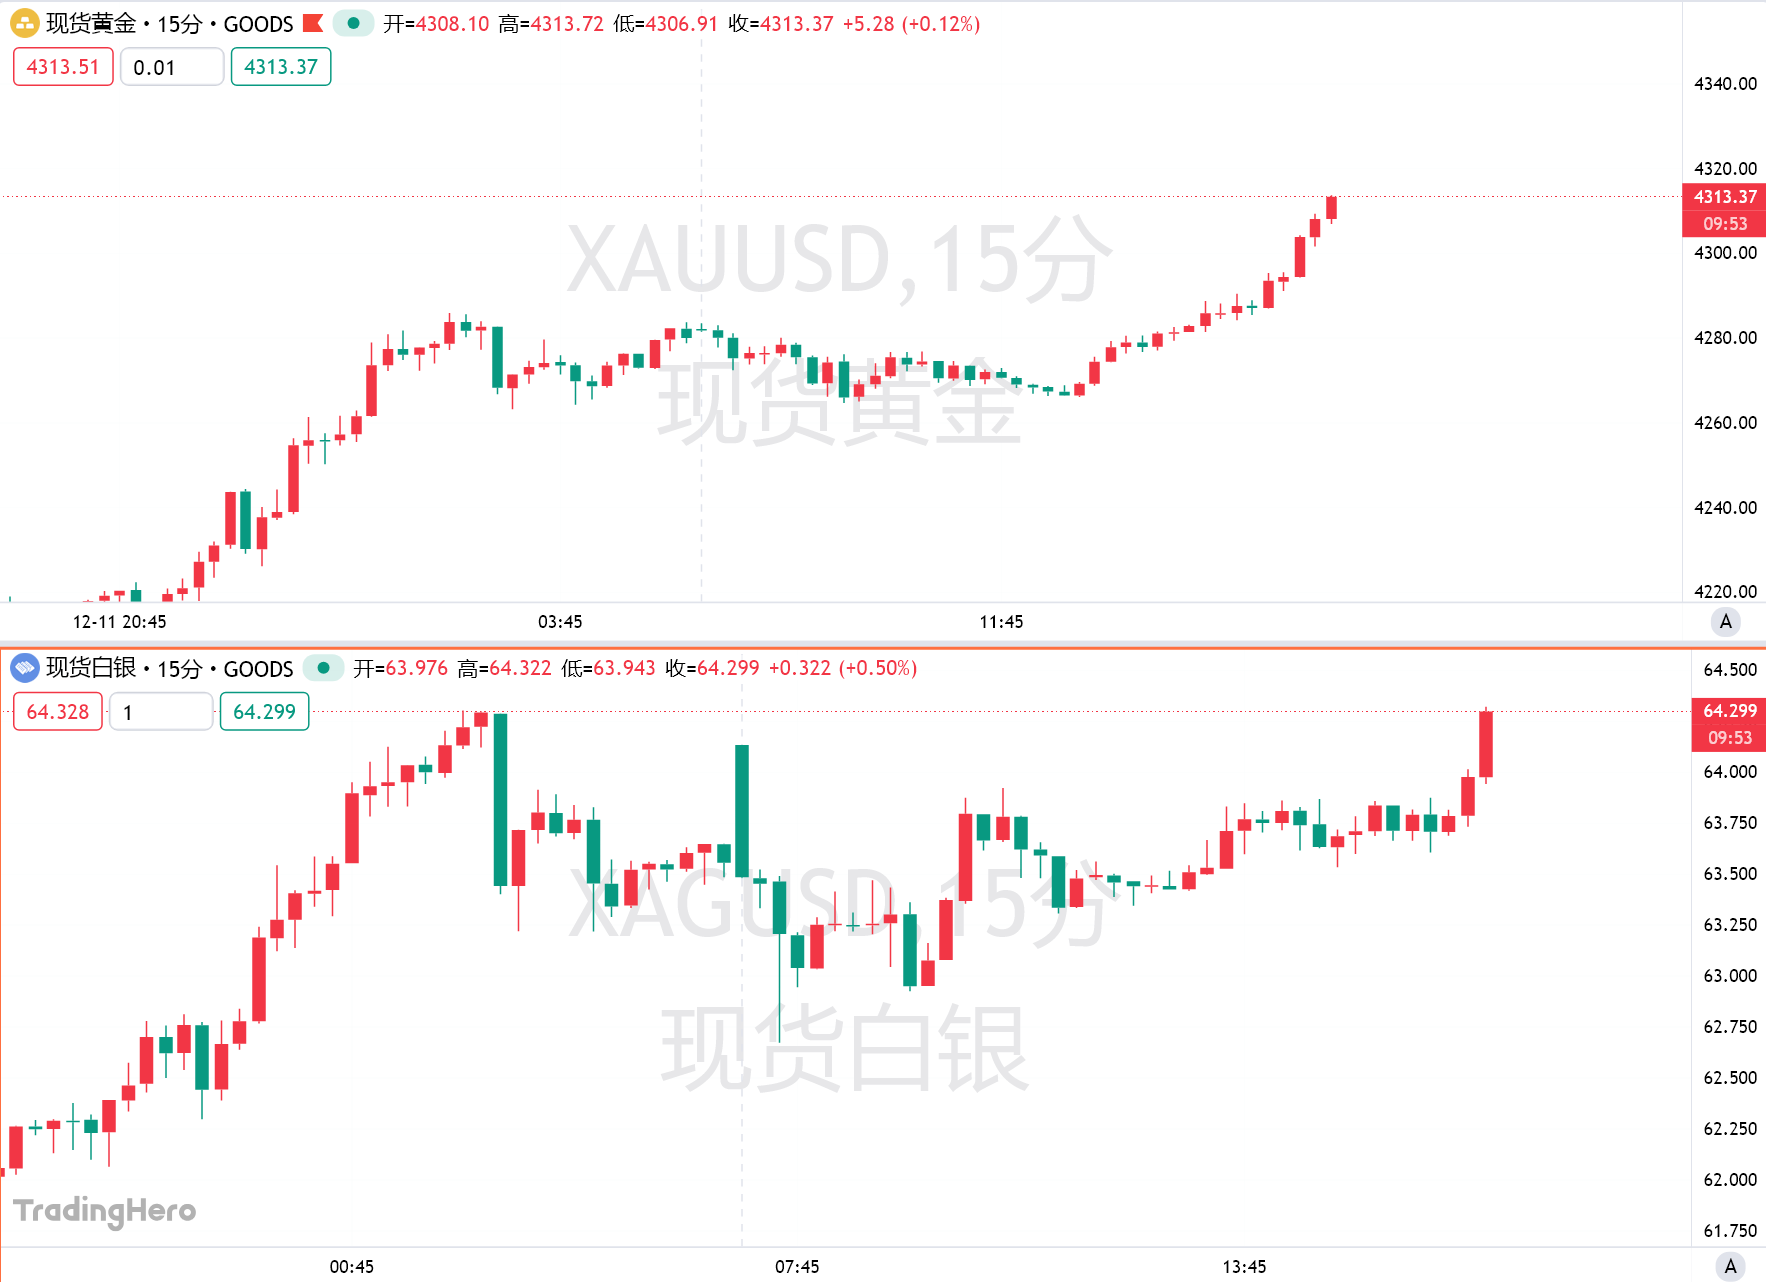
Gold surpasses the $4,310 mark—Is the "bull frenzy" returning?
Boosted by expectations of further easing from the Federal Reserve, gold has risen for four consecutive days. Technical indicators show strong bullish signals, but there remains one more hurdle before reaching a new all-time high.
Trend Research: Why Are We Still Bullish on ETH?
Against the backdrop of relatively accommodative expectations in both China and the US, which suppress asset downside volatility, and with extreme fear and capital sentiment not yet fully recovered, ETH remains in a favorable "buy zone."
