
XRP Faces Potential Decline Below $2 as Bearish Pressures Mount

Ripple’s XRP teeters near $2 support, pressured by whale sell-offs and bearish technical indicators, signaling possible further declines.
Ripple’s XRP has seen its price significantly erode in recent weeks following a meteoric rise of nearly 500% between November 6 and December 3. Since it reached a multi-year high of $2.90 on December 3, the altcoin has been in a downward trend.
With strengthening bearish momentum, the cryptocurrency is poised to fall below the $2 support mark in the near term. This analysis explains why that may happen.
Ripple Token Sees Surge in Selloffs
An assessment of the XRP/USD one-chart has shown that since peaking at $2.90 on December 3, the cryptocurrency has been trapped in a descending triangle, a bearish technical pattern.
This pattern appears when an asset’s price creates a series of lower highs while maintaining a horizontal support level. This pattern indicates increasing selling pressure and often signals a potential bearish breakout if the price falls below the support.
 XRP Descending Triangle. Source:
TradingView
XRP Descending Triangle. Source:
TradingView
For XRP, this support is formed at the critical $2 price level. However, with the strengthening selling pressure, the bulls might find it challenging to defend this price point at this time. One reason for this is the low accumulation from XRP whales in recent weeks.
According to Santiment, XRP whales controlling between 10,000,000 and 100,000,000 tokens have reduced their holdings by 350 million XRP since December 4. This means that during the period in review, this cohort of XRP investors has collectively sold tokens worth $746 million, contributing to the downward pressure on its price.
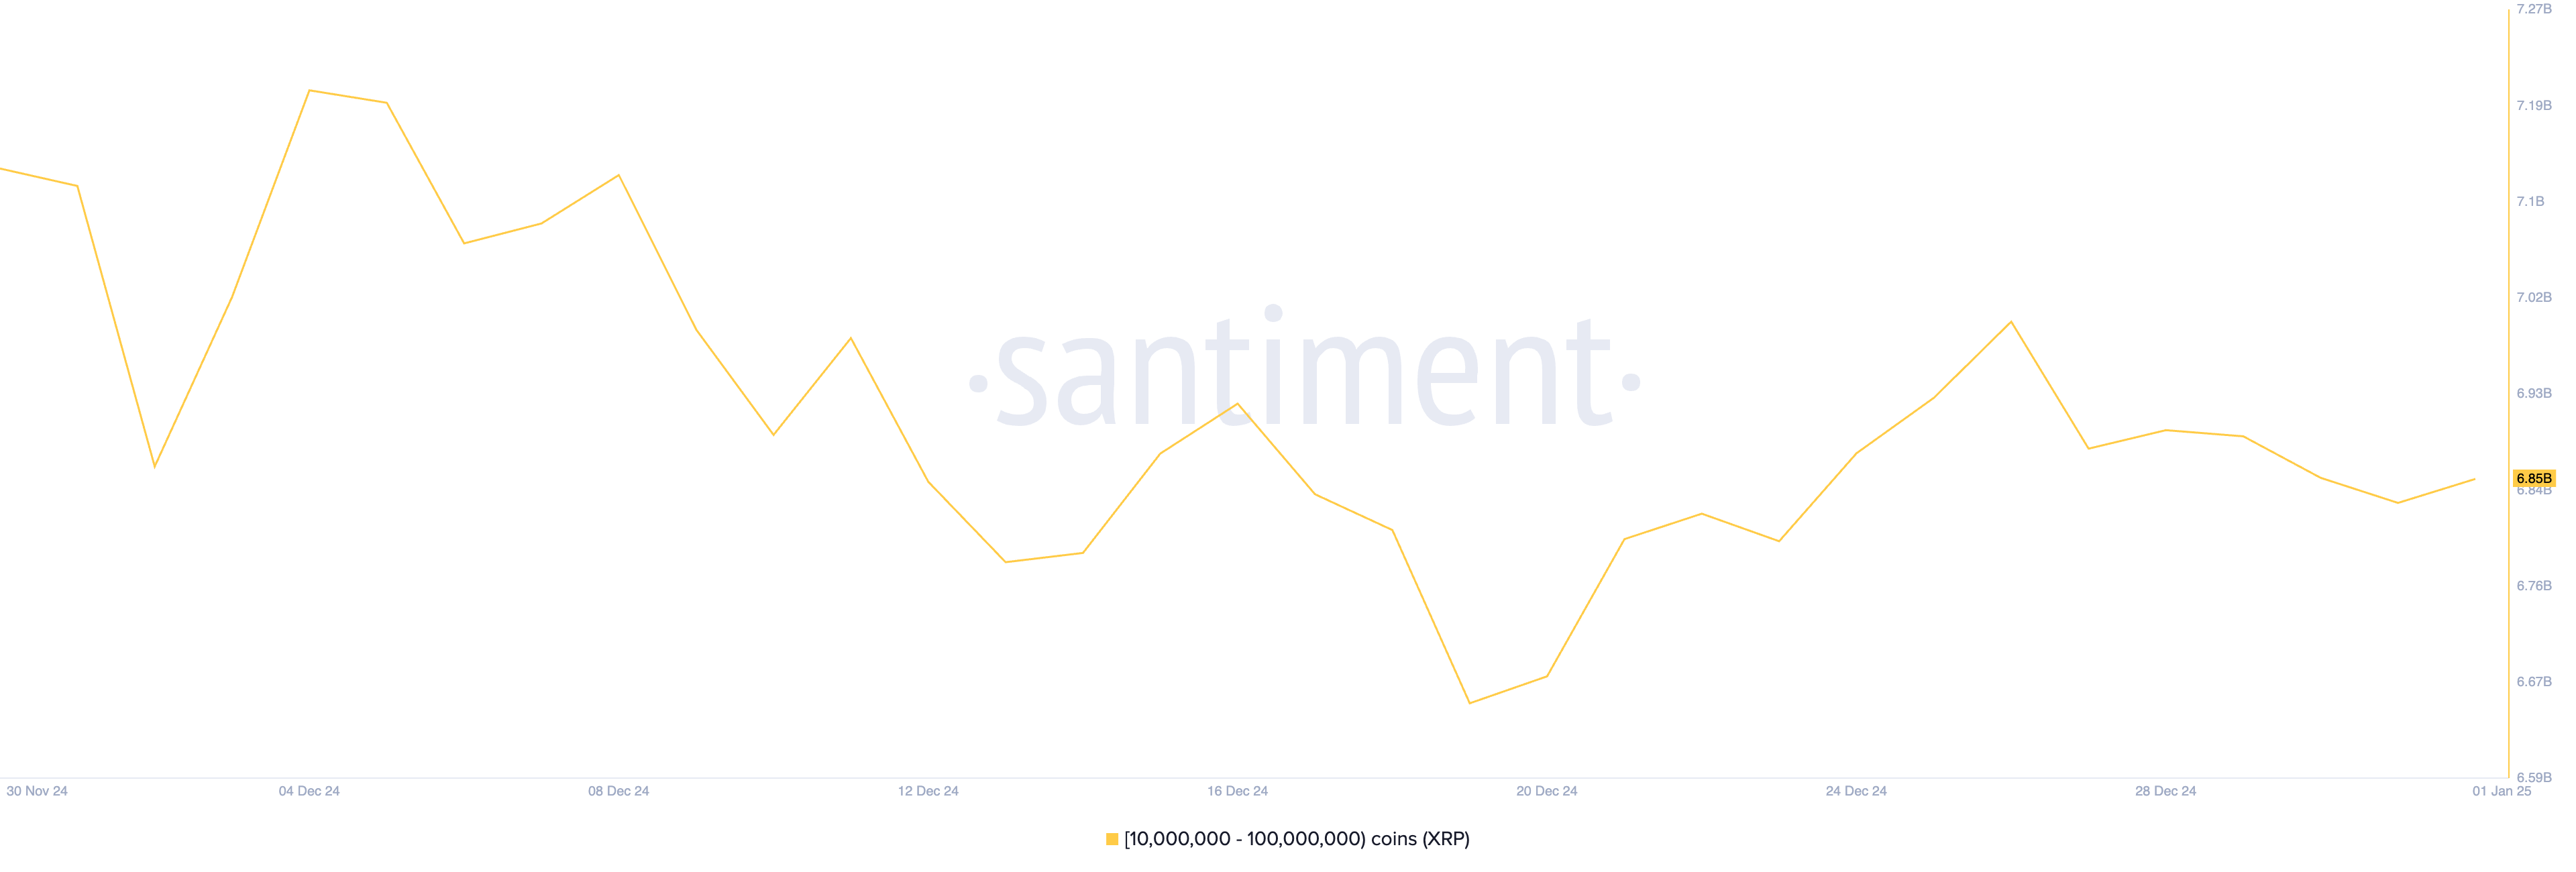 XRP Supply Distribution. Source:
Santiment
XRP Supply Distribution. Source:
Santiment
A reduction in whale accumulation is concerning because these large holders often provide stability to the market by holding substantial amounts of tokens. Their selling activity can trigger panic among smaller investors, worsening price declines and increasing market volatility.
XRP Price Prediction: Will $2 Hold?
On a daily chart, XRP currently trades below its 20-day exponential moving average (EMA), which calculates the average price of an asset over the past 20 days, giving more weight to recent prices to capture short-term trends better.
When an asset’s price drops below this key moving average, it confirms bearish sentiment, indicating a downtrend or increased short-term selling pressure.
If selling pressure strengthens, the XRP token price may break below the $2 support offered by the lower line of its descending triangle. In that scenario, the token’s price will plunge to $1.88. If this level fails to hold, XRP’s price may dip further to $1.34.
 XRP Price Analysis. Source:
TradingView
XRP Price Analysis. Source:
TradingView
On the other hand, if sentiment shifts from bearish to bullish, XRP’s price will climb above its 20-day EMA, which offers a dynamic barrier or resistance at $2.18. A successful breach above this level could propel the XRP token price to its multi-year high of $2.90.
Disclaimer: The content of this article solely reflects the author's opinion and does not represent the platform in any capacity. This article is not intended to serve as a reference for making investment decisions.
You may also like
A decade-long tug-of-war ends: "Crypto Market Structure Bill" sprints to the Senate
At the Blockchain Association Policy Summit, U.S. Senators Gillibrand and Lummis stated that the "Crypto Market Structure Bill" is expected to have its draft released by the end of this week, with revisions and hearings scheduled for next week. The bill aims to establish clear boundaries for digital assets by adopting a classification-based regulatory framework, clearly distinguishing between digital commodities and digital securities, and providing a pathway for exemptions for mature blockchains to ensure that regulation does not stifle technological progress. The bill also requires digital commodity trading platforms to register with the CFTC and establishes a joint advisory committee to prevent regulatory gaps or overlapping oversight. Summary generated by Mars AI. The accuracy and completeness of this summary, generated by the Mars AI model, is still being iteratively updated.

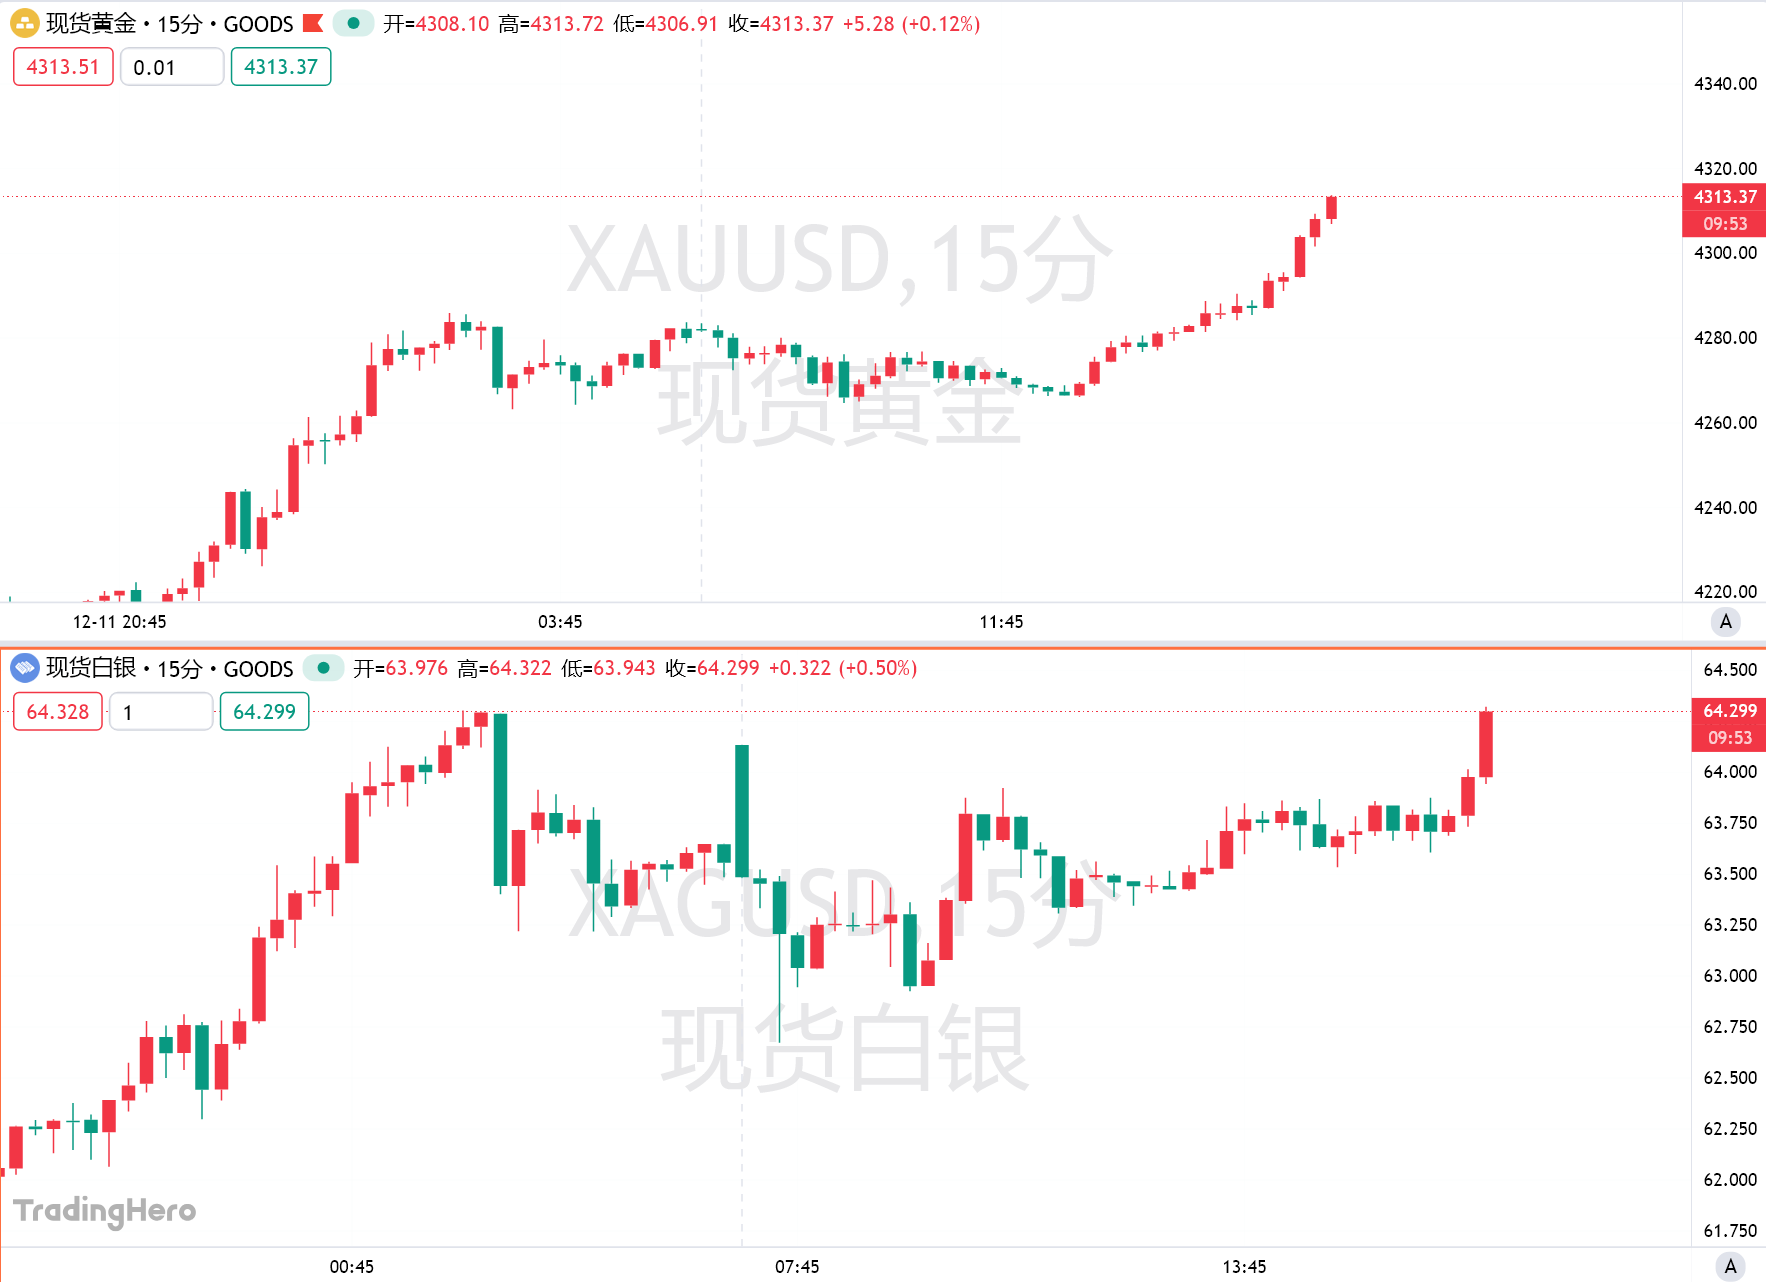
Gold surpasses the $4,310 mark—Is the "bull frenzy" returning?
Boosted by expectations of further easing from the Federal Reserve, gold has risen for four consecutive days. Technical indicators show strong bullish signals, but there remains one more hurdle before reaching a new all-time high.
Trend Research: Why Are We Still Bullish on ETH?
Against the backdrop of relatively accommodative expectations in both China and the US, which suppress asset downside volatility, and with extreme fear and capital sentiment not yet fully recovered, ETH remains in a favorable "buy zone."
