Bitget App
Trade smarter
Buy cryptoMarketsTradeFuturesEarnSquareMore
QUBIC and USTC Approach Key Resistance – Could Breakouts Spark a Rally?

QUBIC and USTC Approach Key Resistance – Could Breakouts Spark a Rally?

CoinsProbeCoinsProbe2025/02/12 17:00
By:Nilesh Hembade

Date: Wed, February 12, 2025 | 10:11 AM GMT

The cryptocurrency market remains under bearish pressure today as investors brace for the upcoming U.S. CPI and PPI data releases. However, despite the broader market caution, Qubic (QUBIC) and TerraClassicUSD (USTC) have posted impressive gains of 6% and 15% in the last 24 hours, bringing them to key resistance levels.

QUBIC and USTC Approach Key Resistance – Could Breakouts Spark a Rally? image 0 
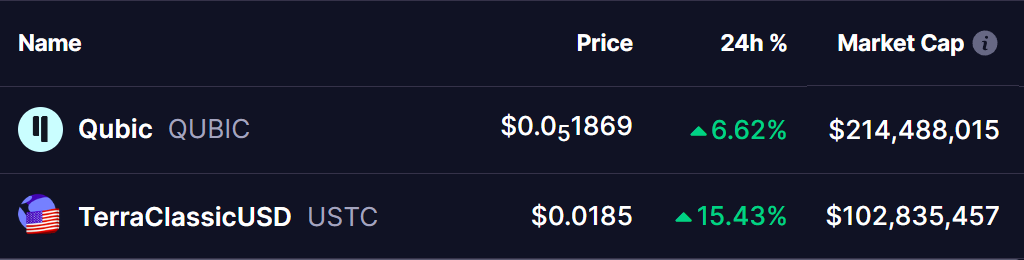
Source: Coinmarketcap

Qubic (QUBIC)

The daily chart for Qubic (QUBIC) reveals a consolidation within a descending triangle and a falling wedge pattern. The downtrend started on January 31 after a rejection at $0.0000022, leading to a sharp decline.

QUBIC and USTC Approach Key Resistance – Could Breakouts Spark a Rally? image 1 
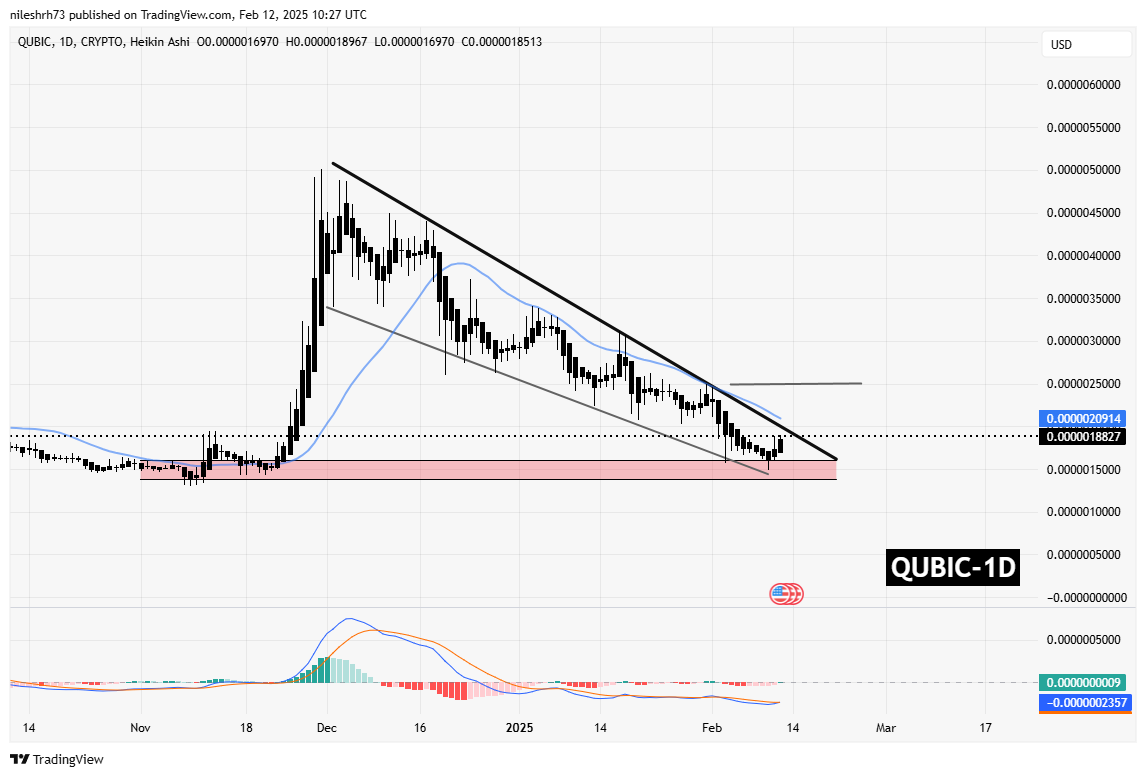
Qubic (QUBIC) Daily Chart/Coinsprobe (Source: Tradingview)

This downward move pushed QUBIC to a crucial support zone of $0.0000015, aligning with the lower boundary of the falling wedge. However, the price has stabilized and is now trading around $0.0000018. Historically, this level has provided strong support, suggesting a potential rebound.

Key Levels to Watch:

  • Bullish Breakout: A move above the 25-day SMA could push QUBIC toward the $0.0000022 resistance, marking a potential 32% gain from current levels.
  • Bearish Scenario: Failure to break out may lead to another retest of the $0.0000015 support zone.

TerraClassicUSD (USTC)

Like QUBIC, TerraClassicUSD (USTC) has been consolidating within a descending triangle. The recent downtrend began on December 2, following a rejection at the $0.032 resistance trendline.

QUBIC and USTC Approach Key Resistance – Could Breakouts Spark a Rally? image 2 
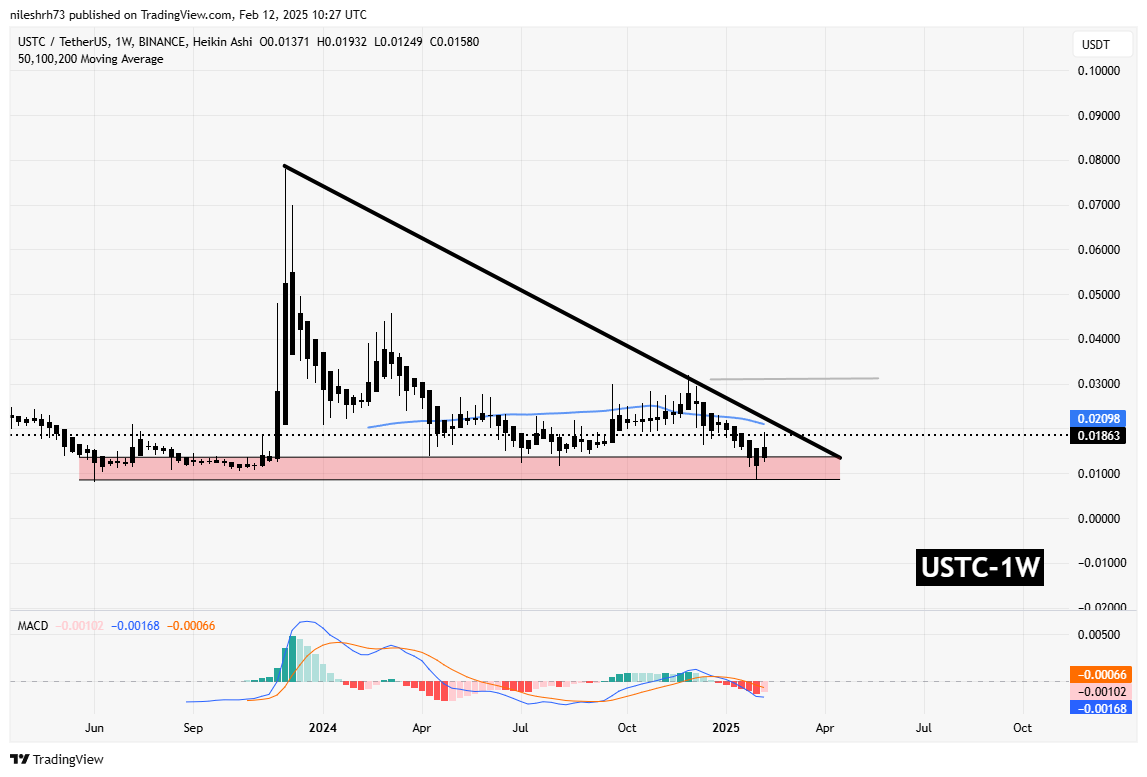
TerraClassicUSD (USTC) Weekly Chart/Coinsprobe (Source: Tradingview)

This correction drove USTC down to a major support zone at $0.0085, where it has held firm. The price is now trading around $0.0186, an area that has historically triggered rebounds.

Key Levels to Watch:

  • Bullish Breakout: A move above the 50-day SMA could see USTC retest the descending trendline. If a breakout occurs, the next target is $0.032.
  • Bearish Scenario: Failure to break out could bring USTC back to test the $0.0085 support zone.

Final Thoughts

With both QUBIC and USTC approaching key resistance levels, traders should closely monitor breakout or breakdown signals. While the broader market remains bearish, these two assets are showing potential bullish setups.

Disclaimer: This article is for informational purposes only and not financial advice. Always conduct your own research before investing in cryptocurrencies.

1

Disclaimer: The content of this article solely reflects the author's opinion and does not represent the platform in any capacity. This article is not intended to serve as a reference for making investment decisions.

PoolX: Earn new token airdrops
Lock your assets and earn 10%+ APR
Lock now!

You may also like

2025 TGE Survival Ranking: Who Will Rise to the Top and Who Will Fall? Complete Grading of 30+ New Tokens, AVICI Dominates S+

The article analyzes the TGE performance of multiple blockchain projects, evaluating project performance using three dimensions: current price versus all-time high, time span, and liquidity-to-market cap ratio. Projects are then categorized into five grades: S, A, B, C, and D. Summary generated by Mars AI This summary was generated by the Mars AI model, and the accuracy and completeness of its content are still being iteratively updated.

MarsBit2025/11/28 16:26
2025 TGE Survival Ranking: Who Will Rise to the Top and Who Will Fall? Complete Grading of 30+ New Tokens, AVICI Dominates S+

Mars Finance | "Machi" increases long positions, profits exceed 10 million dollars, whale shorts 1,000 BTC

Russian households have invested 3.7 billion rubles in cryptocurrency derivatives, mainly dominated by a few large players. INTERPOL has listed cryptocurrency fraud as a global threat. Malicious Chrome extensions are stealing Solana funds. The UK has proposed new tax regulations for DeFi. Bitcoin surpasses $91,000. Summary generated by Mars AI. The accuracy and completeness of this summary are still being iteratively updated by the Mars AI model.

MarsBit2025/11/28 16:26
Mars Finance | "Machi" increases long positions, profits exceed 10 million dollars, whale shorts 1,000 BTC

How much is ETH really worth? Hashed provides 10 different valuation methods in one go

After taking a weighted average, the fair price of ETH exceeds $4,700.

ForesightNews 速递2025/11/28 15:05
How much is ETH really worth? Hashed provides 10 different valuation methods in one go

Dragonfly partner: Crypto has fallen into financial cynicism, and those valuing public blockchains with PE ratios have already lost

People tend to overestimate what can happen in two years, but underestimate what can happen in ten years.

深潮2025/11/28 14:53
Dragonfly partner: Crypto has fallen into financial cynicism, and those valuing public blockchains with PE ratios have already lost