

- Solana (SOL) tests critical support near $117 (horizontal + 1.618 Fib level)
- Analyst Mags outlines bull case (bounce from $117) vs bear case (bleed below $117)
- SOL/BTC pair also tests key Fib support after trendline rejection
Solana (SOL) faces scrutiny after failing to hold above its 20-day Exponential Moving Average (EMA) near $133. This level now acts as key overhead resistance for the altcoin.
The SOL token currently sits near a crucial technical point. Crypto analyst “Mags” highlights two distinct possibilities ahead: a strong bounce towards new highs, or a slow price bleed toward lower support levels.
What are Mags’ Two Scenarios for SOL?
Mags noted on X (formerly Twitter) that SOL hit a new ATH earlier this cycle at $295, but proved unable to sustain momentum above it. He also pointed to a significant bearish divergence appearing on the weekly Relative Strength Index (RSI) around that time, suggesting weakening underlying strength prior to the recent pullback.
As per Mags ’ analysis, SOL now tests a key horizontal support level. This level, near $117, has reportedly held strong over the past year and aligns with the 1.618 Fibonacci retracement mark derived from a previous price swing.
The daily RSI currently reads near 40. Mags observed this RSI level previously acted as a strong support zone for SOL’s price during prior corrections.
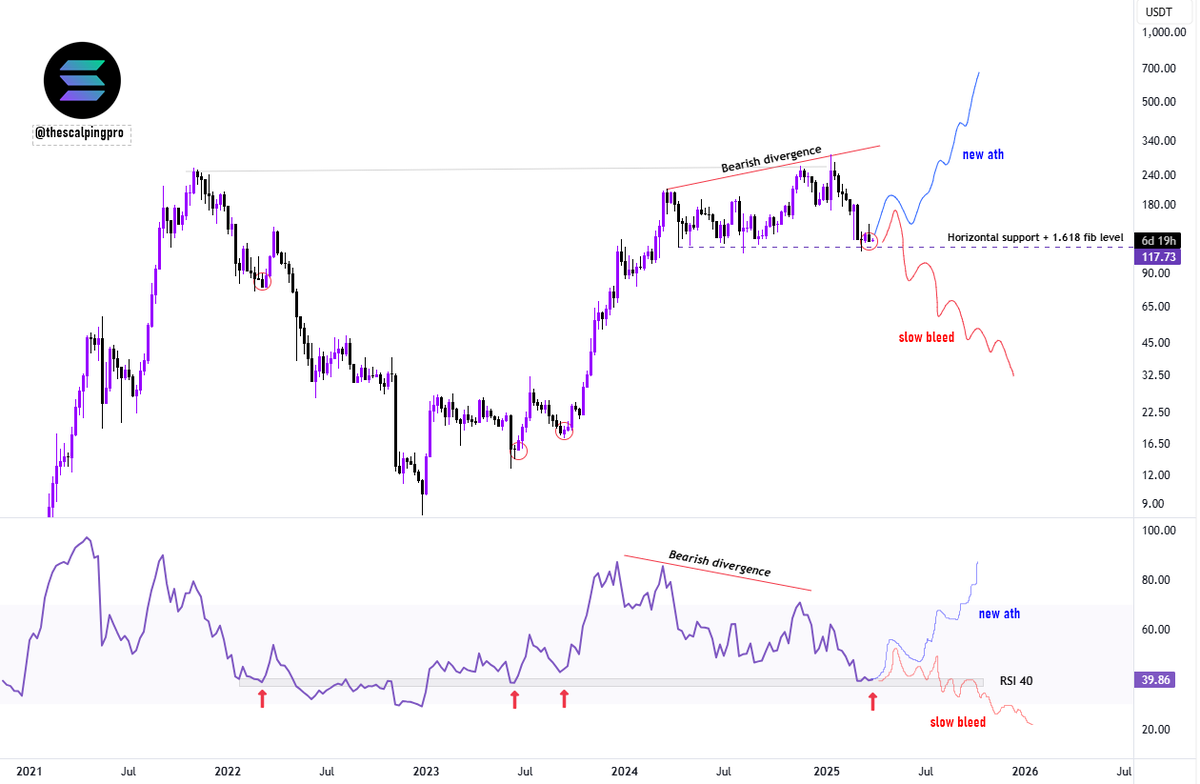
He suggests if history repeats, a price reversal could occur from this confluence of horizontal support and RSI readings near 40, allowing SOL to potentially reclaim upward momentum. However, a decisive breakdown below the $117 area could signal prolonged downside pressure instead.
Mags emphasized these two primary scenarios based on current levels:
- Bullish Case (Blue Scenario): If SOL manages to hold the ~$117 support level effectively, a strong bounce could follow. This could potentially lead to a breakout and a continuation towards new highs, supported by the RSI having room to climb.
- Bearish Case (Red Scenario): If any bounce from current levels is weak and fails to sustain itself, SOL may enter a “slow bleed” pattern. This implies breaking below both horizontal support and the 1.618 Fibonacci level near $117, which would indicate bearish continuation targeting lower price levels.
Related: Solana (SOL) Sentiment Goes Parabolic: 18x More Positive Comments Than Negative
SOL/BTC Pair Also at Key Technical Juncture
The SOL/BTC trading pair reflects a similar situation, also sitting at a crucial technical juncture according to Mags. Another chart shared by the analyst shows SOL was recently rejected from a long-term falling trendline resistance against Bitcoin, forming lower highs.
Related: Solana’s “Breakout” Moment? Hackathon BlackRock Signal Growing Ecosystem
The SOL/BTC pair currently tests support near the critical 0.618 Fibonacci level. This adds technical confluence, highlighting the importance of the current support zone for SOL’s performance relative to both the US dollar and Bitcoin.
That long-term SOL/BTC trendline resistance has remained unbroken for months, indicating persistent overhead selling pressure on SOL compared to Bitcoin during that period. If SOL/BTC can decisively reclaim this trendline, it could signal a bullish resurgence for Solana versus Bitcoin.
Conversely, failure to hold the current 0.618 Fib support here could lead to further relative downside, potentially confirming the bearish divergence implications seen on the USDT pair chart.
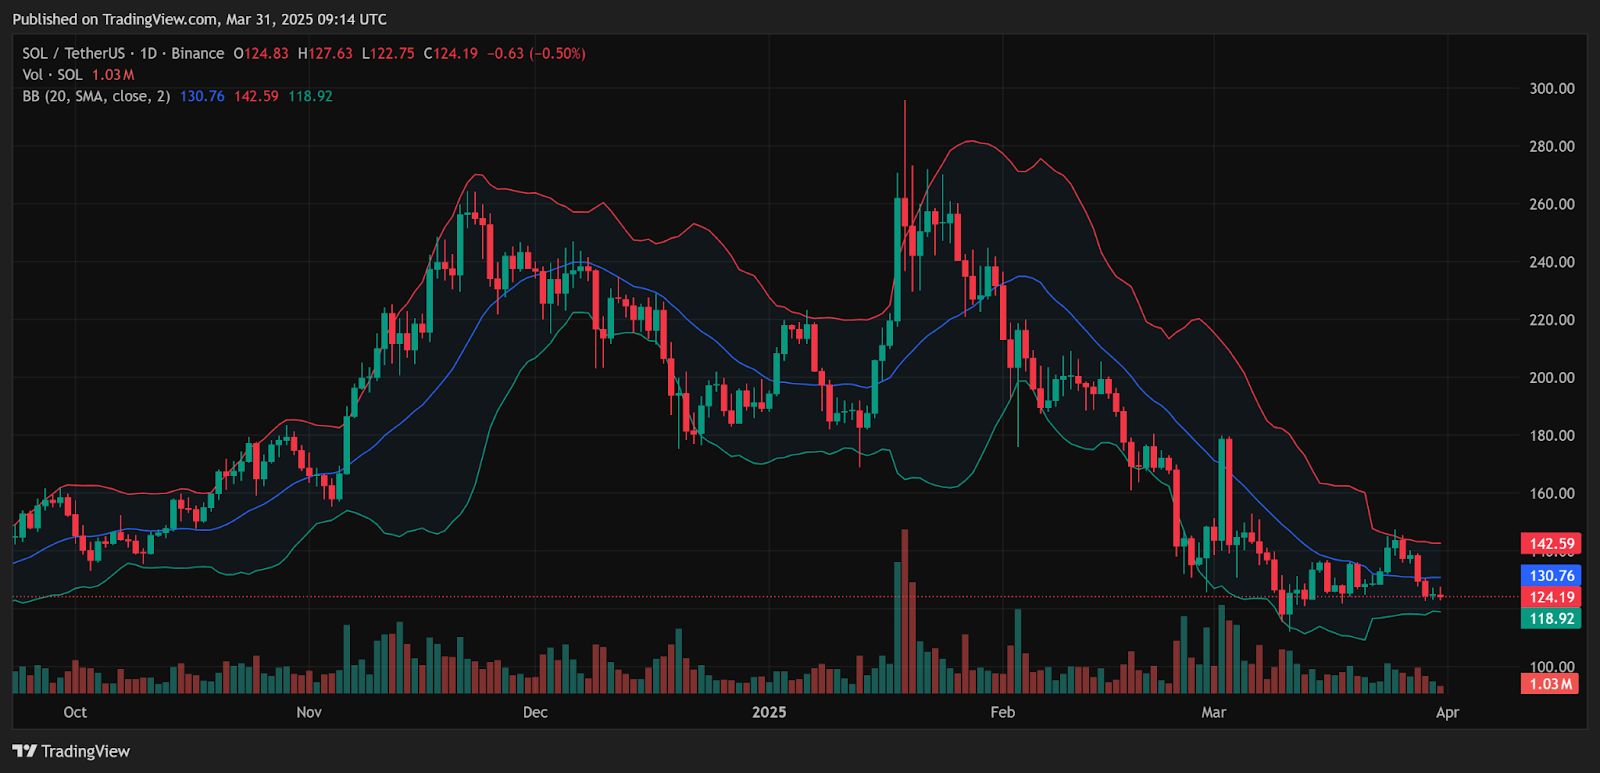
Looking at the daily SOL/USDT chart, Bollinger Bands (BB) offer additional context. The price currently trades below the middle BB band (around $130.76). It now approaches a test of the lower BB band support, located near $118.92.
Disclaimer: The information presented in this article is for informational and educational purposes only. The article does not constitute financial advice or advice of any kind. Coin Edition is not responsible for any losses incurred as a result of the utilization of content, products, or services mentioned. Readers are advised to exercise caution before taking any action related to the company.