
On-chain Data Academy (Part 5): How Many People Are Actually Making Money? A Five-Minute Overview of the Objective Sentiment Indicator PSIP

This article will focus on introducing the on-chain metric PSIP.
Original Article Title: "On-Chain Data Classroom (Part 5): How Many People Are Actually Making Money? A Five-Minute Guide to the Objective Sentiment Indicator PSIP!"
Original Article Author: Mr. Berg, On-Chain Data Analyst
This article is the 5th part of the On-Chain Data Classroom series, with a total of 10 parts. It will take you step by step through understanding on-chain data analysis. Interested readers are welcome to follow this series.
Related Reading: "On-Chain Data Classroom (Part 4): Visualized BTC Chip Price Distribution Chart"
TL;DR
- This article will introduce the on-chain indicator PSIP
- PSIP = Percentage of Supply in Profit, among circulating $BTC
- It can serve as a guide to market sentiment, with applications in recognizing market tops and bottoms
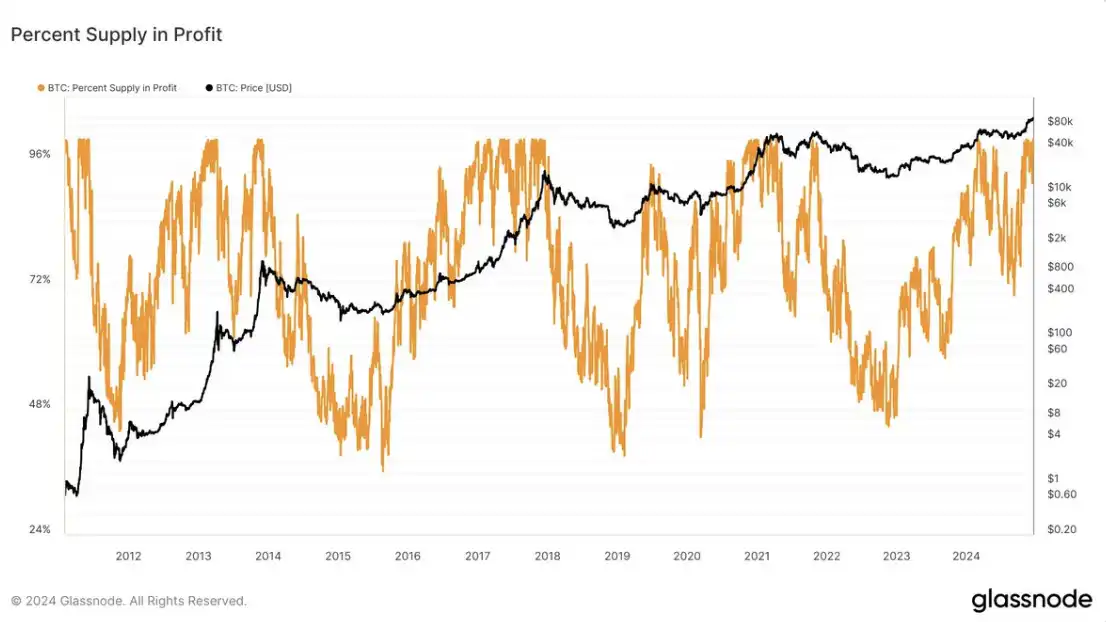
What is PSIP?
PSIP, short for Percent Supply in Profit, is defined as "the percentage of circulating $BTC that is in a state of profit."
Calculation method:
It distinguishes profit and loss chips by "comparing each $BTC's last transfer price with the current price."
When the current price is higher than a certain $BTC's last transfer price, this $BTC is considered a profit chip.
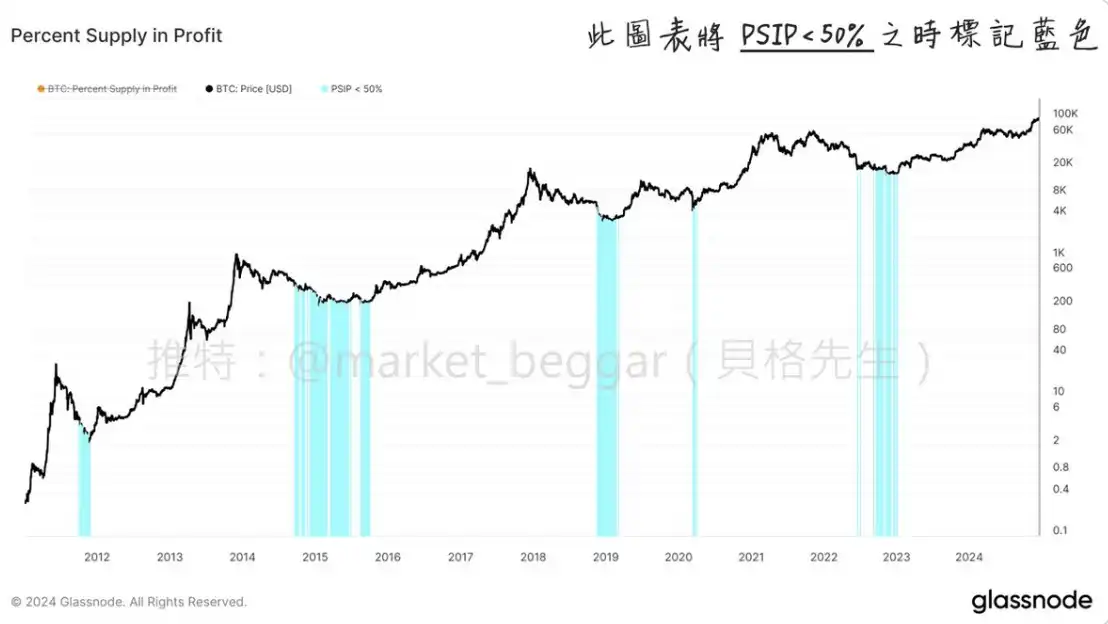
What if Most Chips Are in a Loss...?
An important application scenario of PSIP is market bottoms. When most chips are in a loss, it is usually a good time to buy the dip.
The logic is straightforward:
Under similar conditions, the more profitable holders, the greater the selling pressure from profit-taking in the market, and vice versa.
As shown in the chart below, historical points where $BTC had PSIP <50% are marked, indicating very precise opportunities to buy the dip
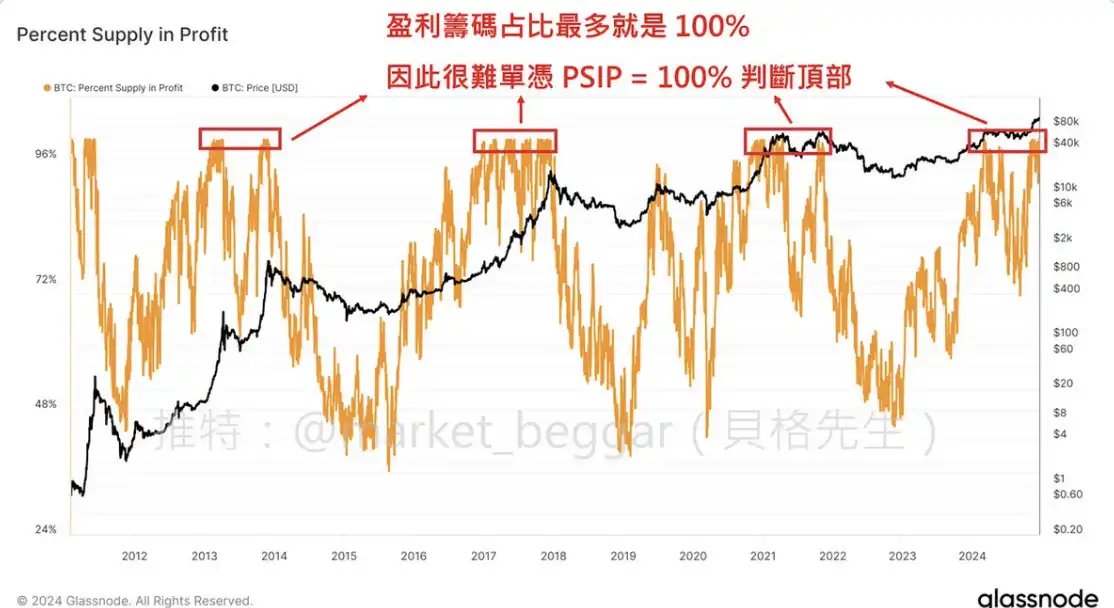
What if the Majority of Chips are in Profit?
As shown in the chart below, the percentage of chips in profit reaches a maximum value of 100%. Therefore, it is difficult to determine a top based solely on high PSIP.
Here is an interesting logic to share: “Observe the Correlation Change between PSIP and Price”
This idea is derived from the following analysis: The Market Pulse – Week 36, 2022
Conclusion
The above is all the content of On-Chain Data School (Part Five). For readers interested in further studying on-chain data analysis, remember to keep track of this series of articles!
If you want to see more analysis and teaching content on on-chain data, feel free to follow my Twitter account (X)!
I hope this article has been helpful to you. Thank you for reading.
Disclaimer: The content of this article solely reflects the author's opinion and does not represent the platform in any capacity. This article is not intended to serve as a reference for making investment decisions.
You may also like
Bitget donates HK$12 million to support fire rescue and reconstruction efforts in Tai Po, Hong Kong
Bitget Spot Margin Announcement on Suspension of ELX/USDT Margin Trading Services
Enjoy perks for new grid traders and receive dual rewards totaling 150 USDT
Bitget Spot Margin Announcement on Suspension of BEAM/USDT, ZEREBRO/USDT, AVAIL/USDT, HIPPO/USDT, ORBS/USDT Margin Trading Services