

Date: Mon, April 07, 2025 | 05:10 AM GMT
The crypto market is reeling from what many are calling the worst single-day drop of 2025 so far. Triggered by a fresh wave of global uncertainty—fueled by a tariff war initiated by U.S. President Donald Trump targeting 185 nations—risk assets across the board are in retreat.
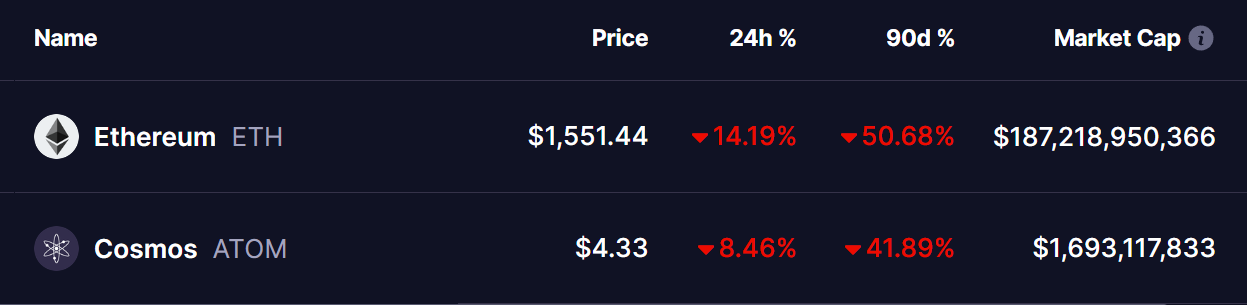
Bitcoin (BTC) has plunged 8%, while Ethereum (ETH) has fared even worse, losing over 14% in just 24 hours. This macro-induced selloff has sent altcoins tumbling as well.
Among them, Cosmos (ATOM) is down over 9% today, extending its 90-day correction to a painful 41%. However, beneath the surface of this selloff, a surprisingly optimistic pattern is emerging—one that strongly mirrors Solana’s (SOL) late 2024 breakout structure.
 Source: Coinmarketcap
ATOM Chart Mirrors SOL’s Past Price Behavior
Looking at the daily chart, ATOM has been forming a classic inverse head and shoulders pattern, a well-known bullish reversal setup. This pattern is also strikingly similar to what Solana (SOL) formed in late 2024 before its impressive rally to over $250.
SOL’s Breakout: Back in October 2024, Solana broke out of a multi-month inverse head and shoulders pattern, facing rejection at the neckline a few times before decisively clearing it. Once it broke through the resistance and the 50-day moving average, SOL soared nearly 60% in just a matter of weeks.
ATOM’s Current Setup: ATOM is now following an almost identical structure. After bouncing off its second shoulder, it’s making a run toward the neckline resistance just above the $5 mark. It’s also testing its 50-day moving average, just as Solana did prior to its breakout.
Should ATOM break above the neckline resistance with strong volume, a bullish reversal could unfold—potentially targeting the $5.80 to $6.40 range in the short term. This would mirror SOL’s breakout trajectory and give bulls a much-needed win in the current bearish climate.
What’s Next for ATOM?
While macroeconomic headwinds remain strong, technical setups like this can often front-run sentiment shifts—especially when driven by historical price patterns.
Disclaimer: This article is for informational purposes only and not financial advice. Always conduct your own research before investing in cryptocurrencies.


