
Ethereum (ETH) Tanks to March 2023 Levels as ETH/BTC Ratio Plummets to 5-Year Low

Ethereum has hit its lowest point since March 2023, driven by a plummeting ETH/BTC ratio and weakening demand. However, with an oversold RSI, a potential rebound might be in the cards.
The value of the leading altcoin, Ethereum, has plunged to its lowest point since March 2023, signaling a steep decline in market confidence. This has happened amid the broader market’s downturn, which was exacerbated by Donald Trump’s Liberation Day.
Compounding the bearish sentiment, the ETH/BTC ratio has now dropped to a five-year low, indicating that Bitcoin is gaining relative strength against Ethereum.
ETH/BTC Ratio Hits 5-Year Low as Traders Flee
ETH’s price decline has pushed the ETH/BTC ratio to a five-year low of 0.019. This ratio measures ETH’s relative value compared to BTC. When it rises, it indicates that ETH is outperforming BTC, either because the altcoin’s price is growing faster or the king coin’s price is falling.
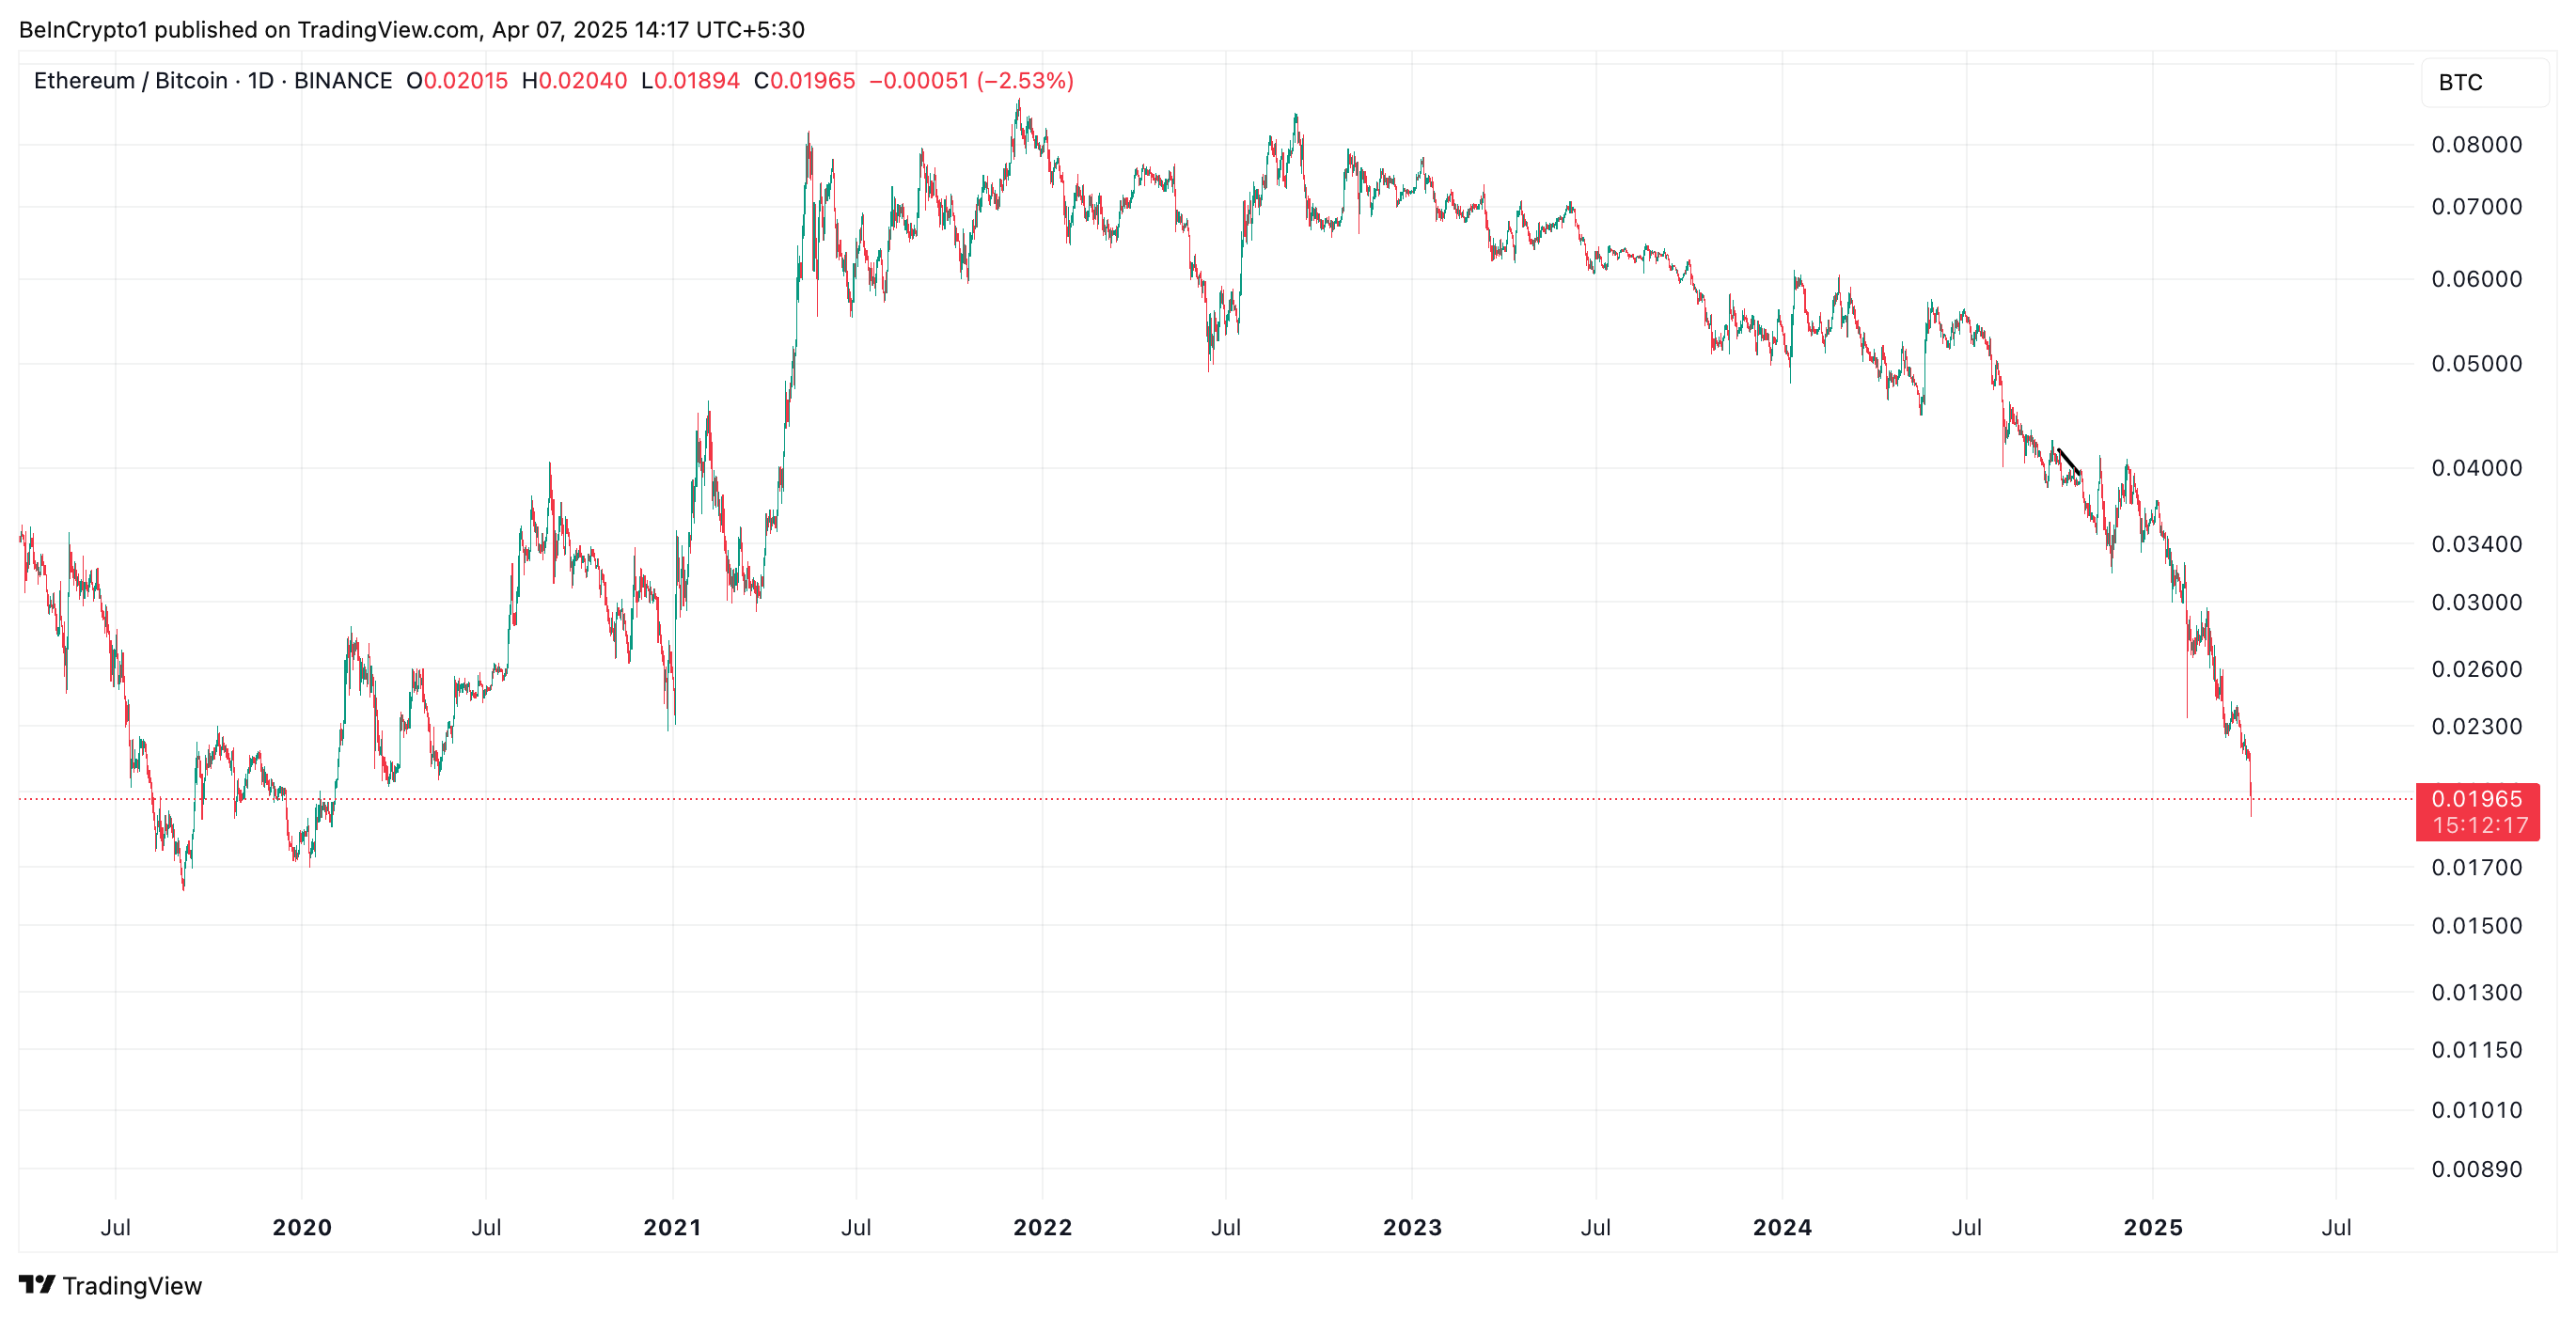 ETH/BTC Ratio. Source:
TradingView
ETH/BTC Ratio. Source:
TradingView
Conversely, a decline like this suggests that the leading coin, BTC, is gaining strength relative to the top altcoin, ETH. It suggests that traders are moving capital into BTC, seeing it as a safer or more profitable investment at the moment despite its own price troubles.
Further, on the daily chart, ETH’s negative Chaikin Money Flow (CMF) confirms the coin’s plummeting demand. At press time, it is at -0.07.
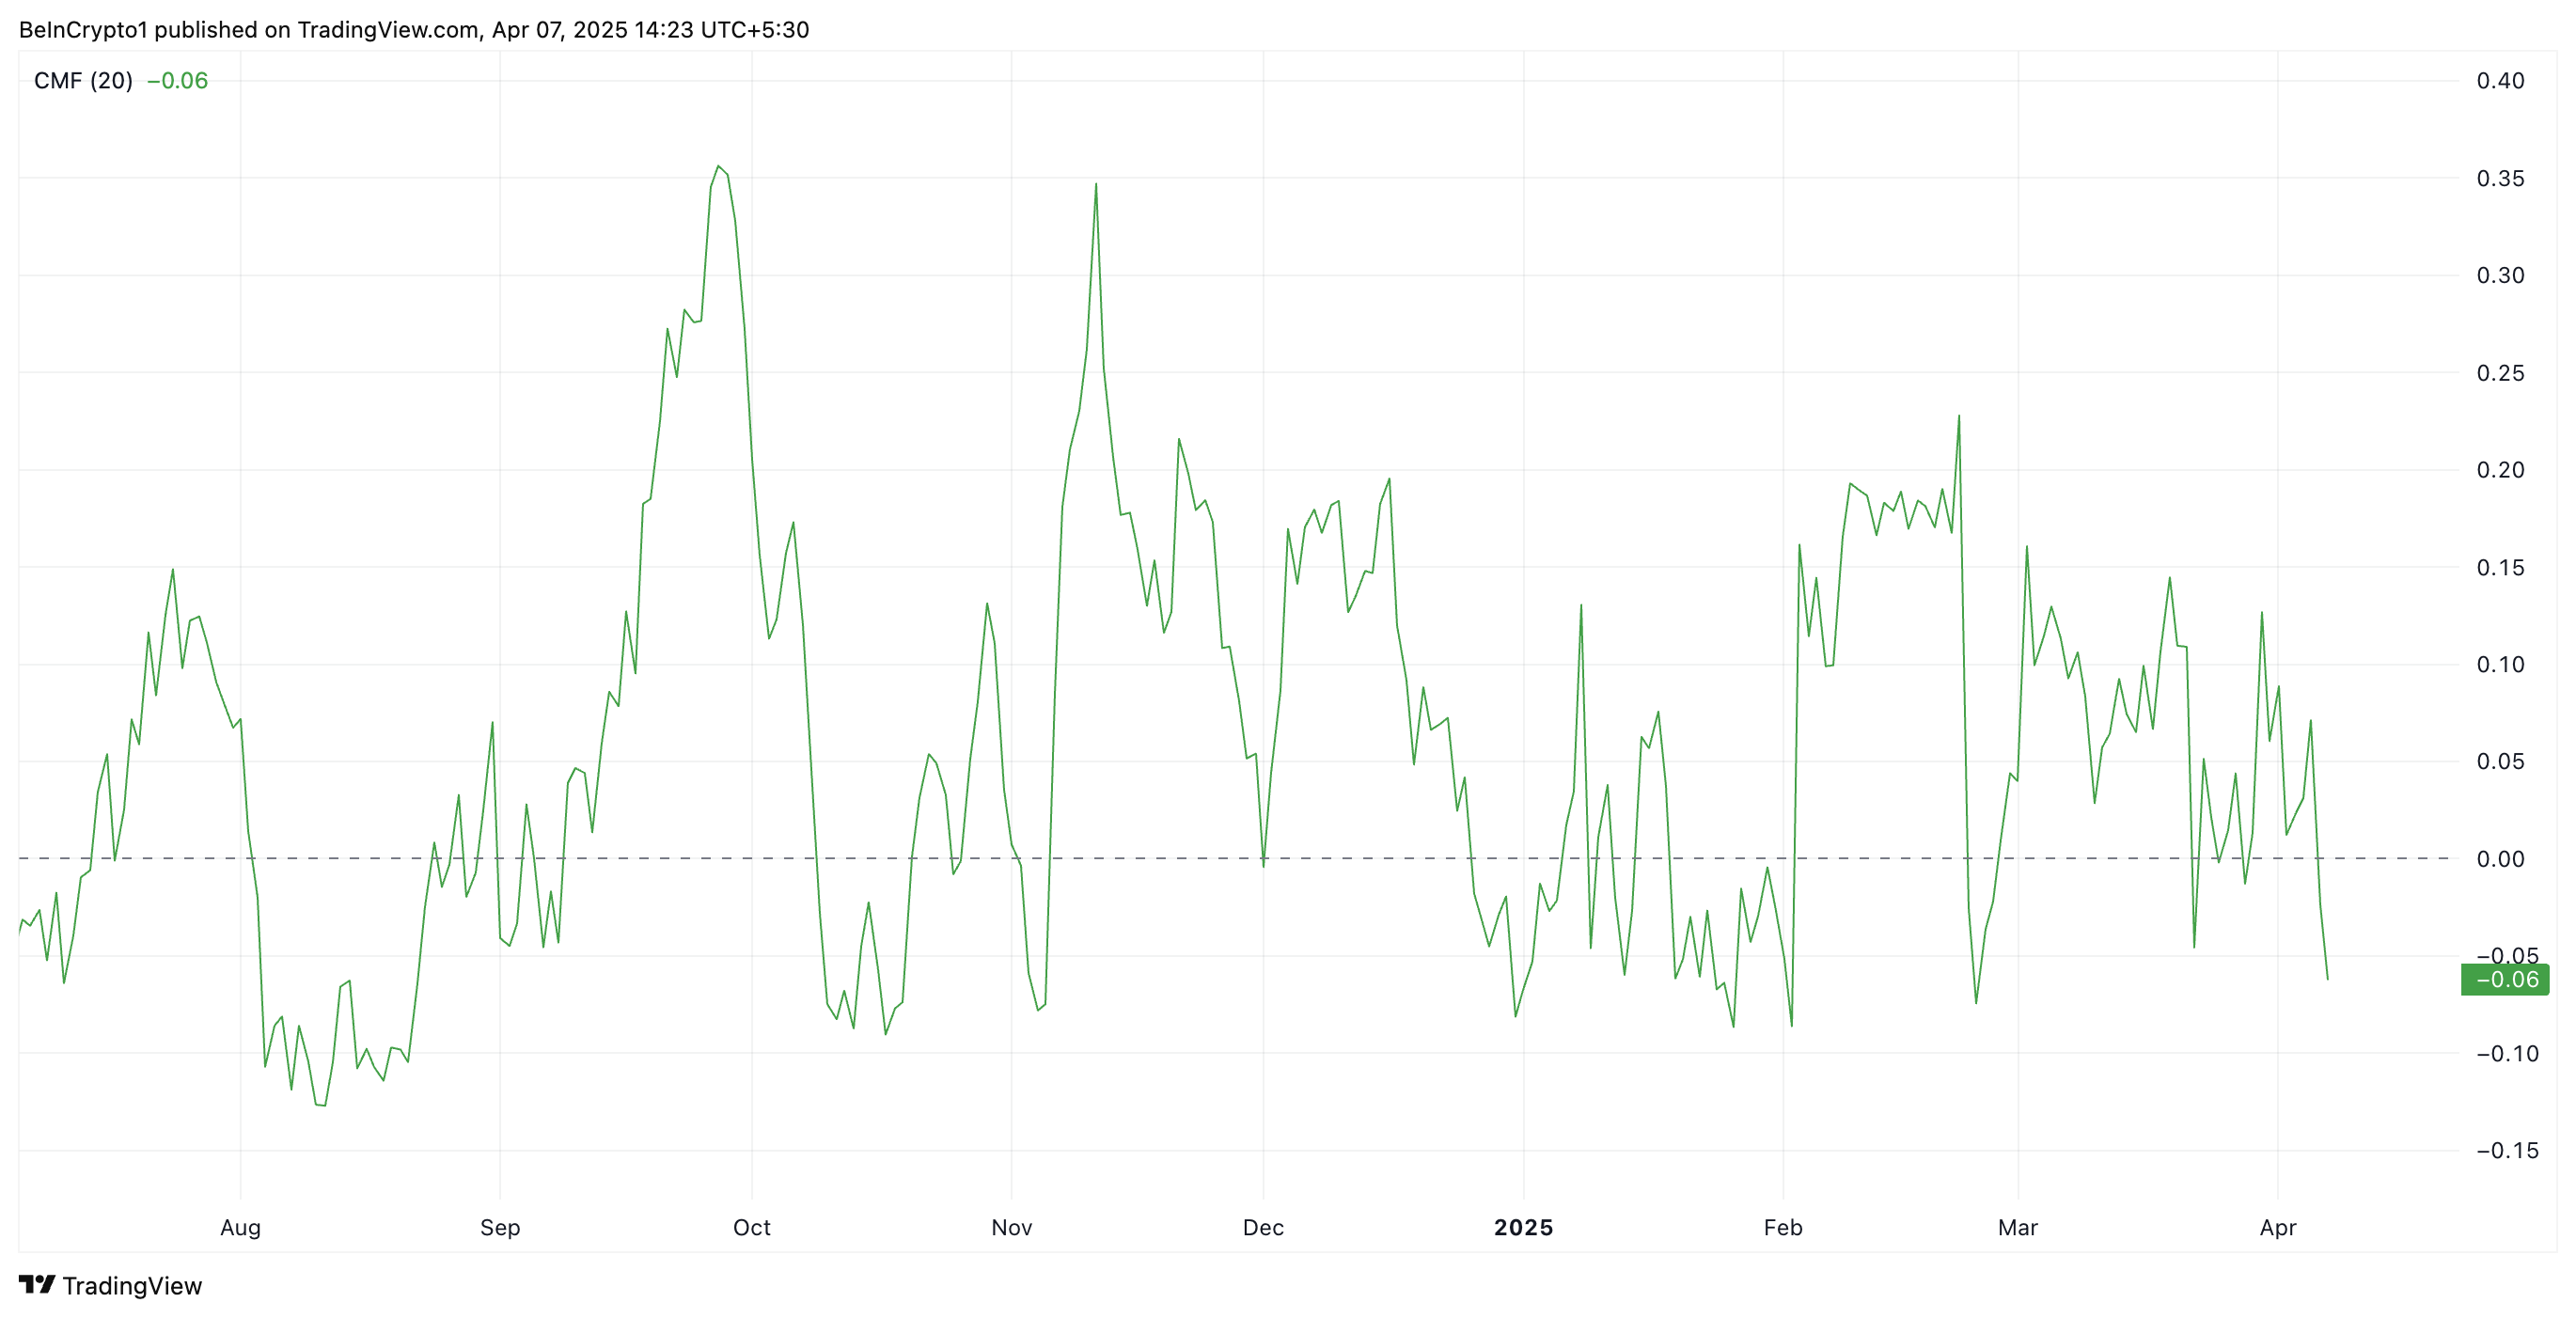 ETH Chaikin Money Flow. Source:
TradingView
ETH Chaikin Money Flow. Source:
TradingView
The CMF indicator measures the volume-weighted accumulation and distribution of an asset over a set period, helping gauge buying and selling pressure. When its value falls below zero like this, it indicates that selling pressure is dominating.
ETH’s CMF readings suggest that more traders are distributing (selling) the coin than accumulating it. This reflects weakening demand and is a bearish signal for the asset’s price momentum.
ETH Flashes Oversold Signal: Is a Bounce Back on the Horizon?
ETH’s Relative Strength Index (RSI), observed on a one-day chart, shows that the altcoin is currently oversold. At press time, the momentum indicator is in a downtrend at 25.62.
The RSI indicator measures an asset’s overbought and oversold market conditions. It ranges between 0 and 100. Values above 70 suggest that the asset is overbought and due for a price decline, while values under 30 indicate that the asset is oversold and may witness a rebound.
At 25.62, ETH’s RSI signals that the coin is deeply oversold. This presents a buying opportunity, as such lows are usually followed by a price rebound.
If this happens, ETH’s price could regain and climb back above $1,589. If this support level strengthens, it could propel ETH’s value to $1,904.
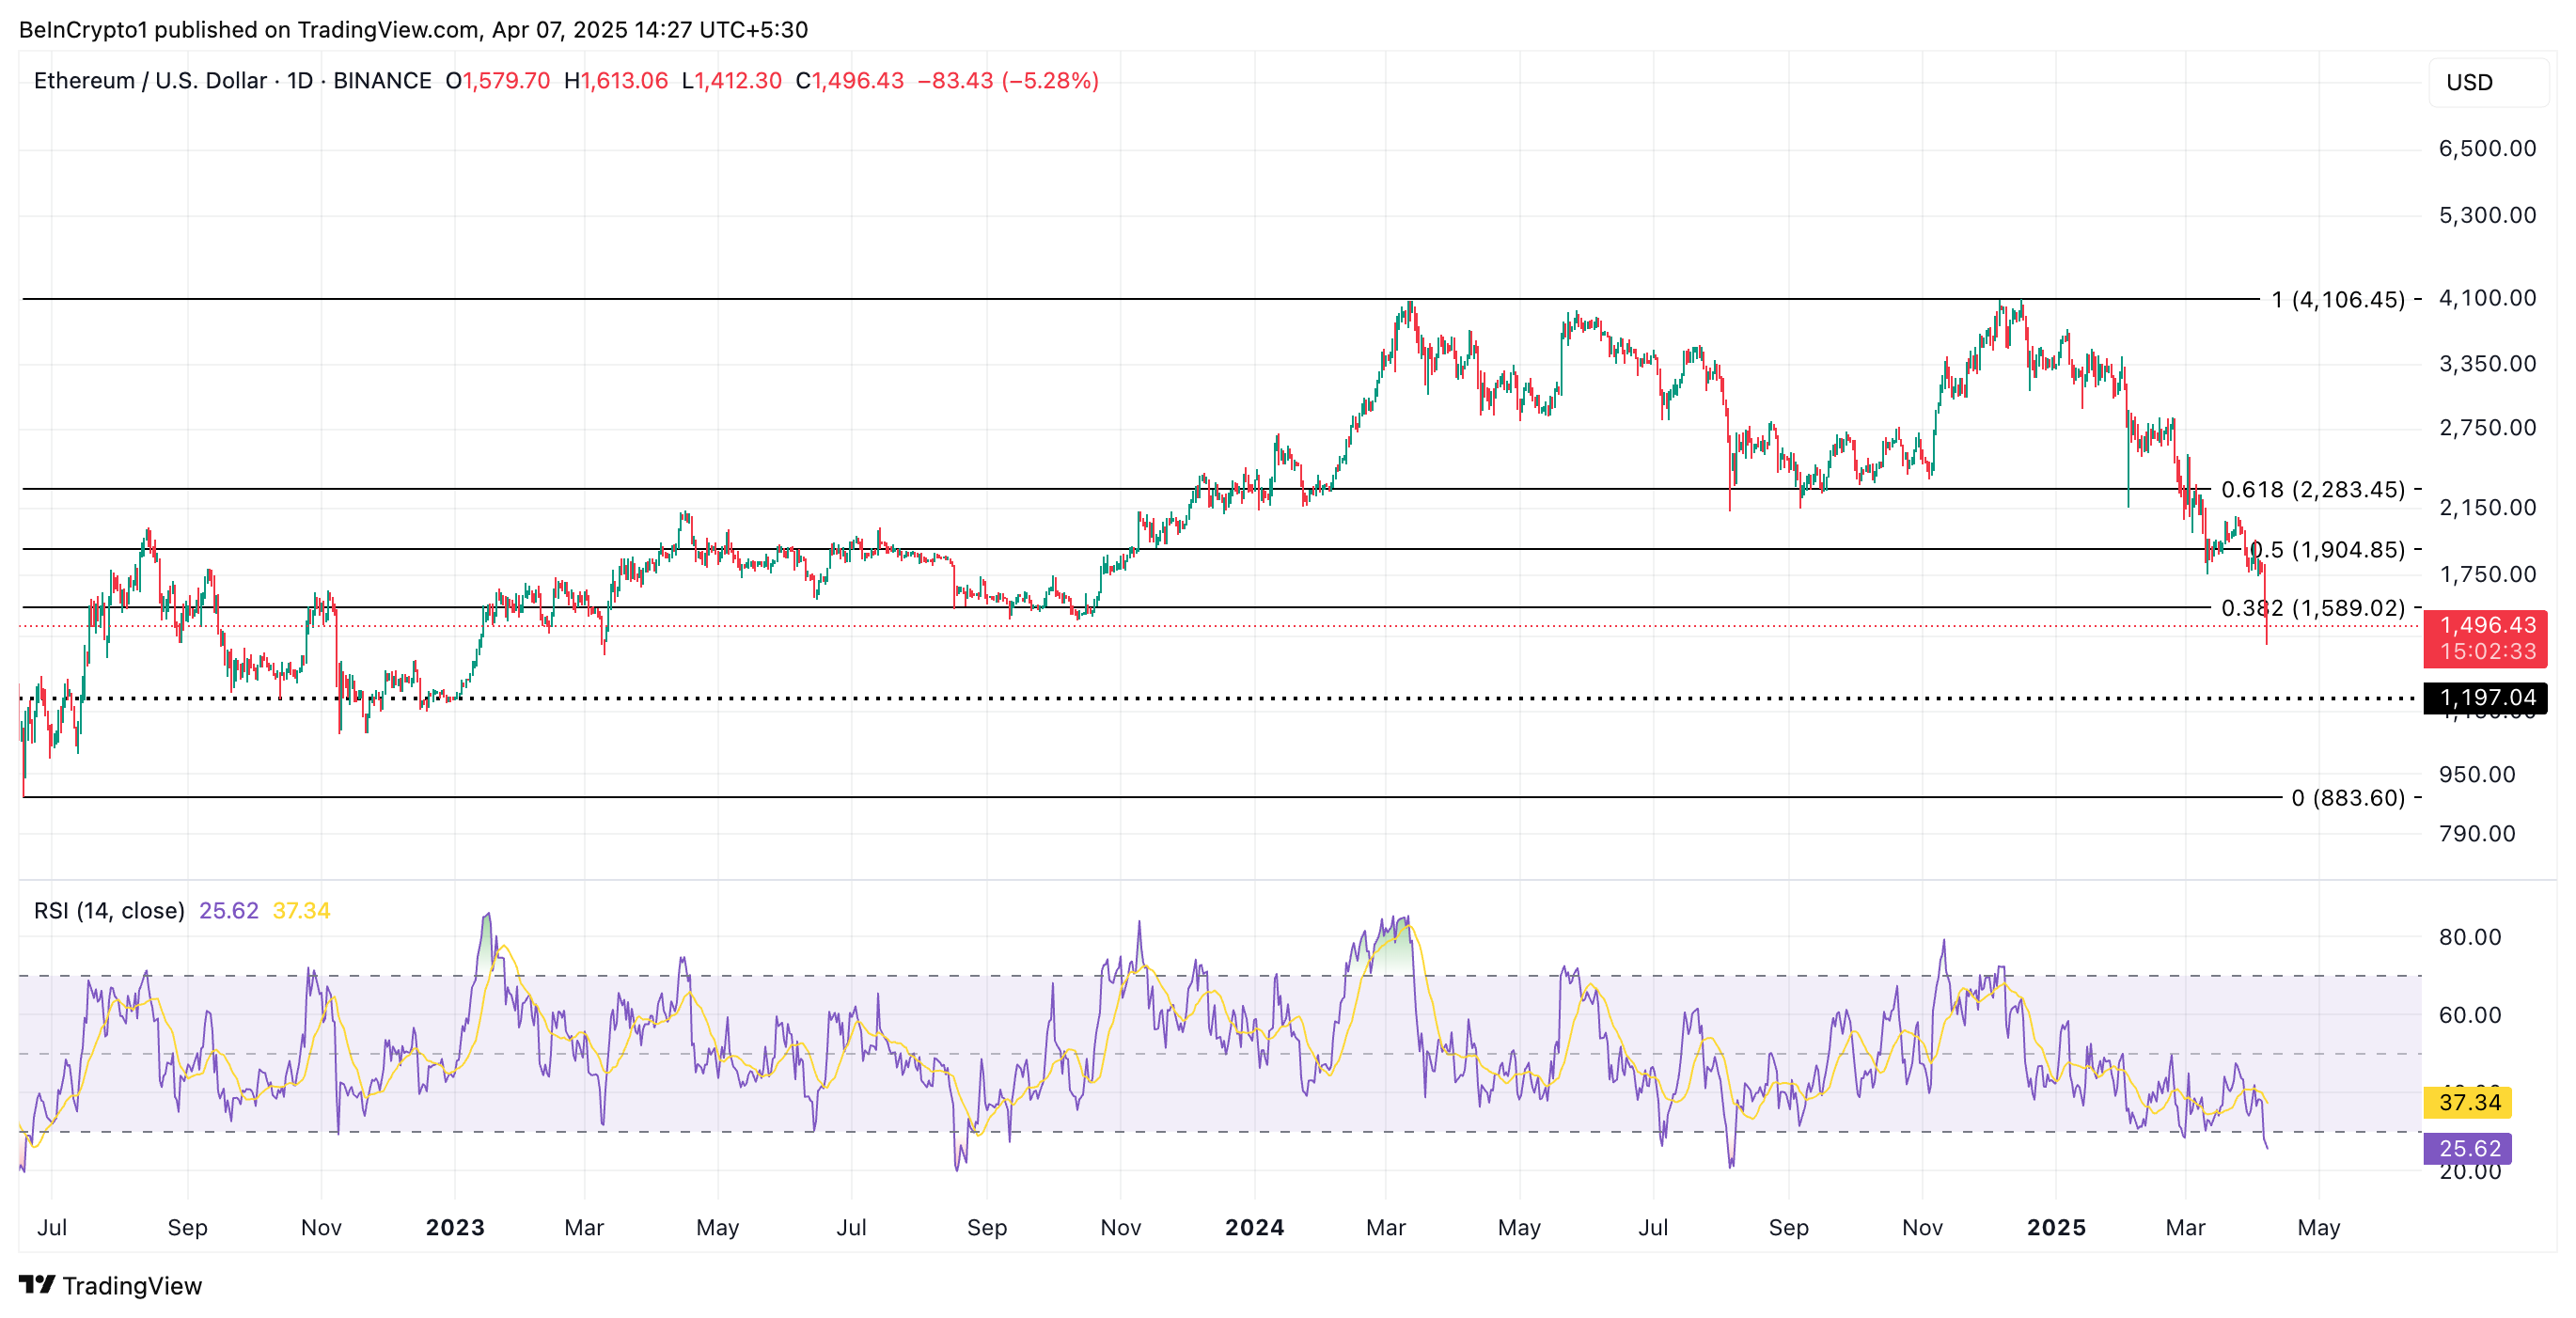 ETH Price Analysis. Source:
TradingView
ETH Price Analysis. Source:
TradingView
However, this rebound is not guaranteed. If ETH bears maintain dominance and selloffs continue, the coin could extend its decline and fall toward $1,197.
Disclaimer: The content of this article solely reflects the author's opinion and does not represent the platform in any capacity. This article is not intended to serve as a reference for making investment decisions.
You may also like
A decade-long tug-of-war ends: "Crypto Market Structure Bill" sprints to the Senate
At the Blockchain Association Policy Summit, U.S. Senators Gillibrand and Lummis stated that the "Crypto Market Structure Bill" is expected to have its draft released by the end of this week, with revisions and hearings scheduled for next week. The bill aims to establish clear boundaries for digital assets by adopting a classification-based regulatory framework, clearly distinguishing between digital commodities and digital securities, and providing a pathway for exemptions for mature blockchains to ensure that regulation does not stifle technological progress. The bill also requires digital commodity trading platforms to register with the CFTC and establishes a joint advisory committee to prevent regulatory gaps or overlapping oversight. Summary generated by Mars AI. The accuracy and completeness of this summary, generated by the Mars AI model, is still being iteratively updated.

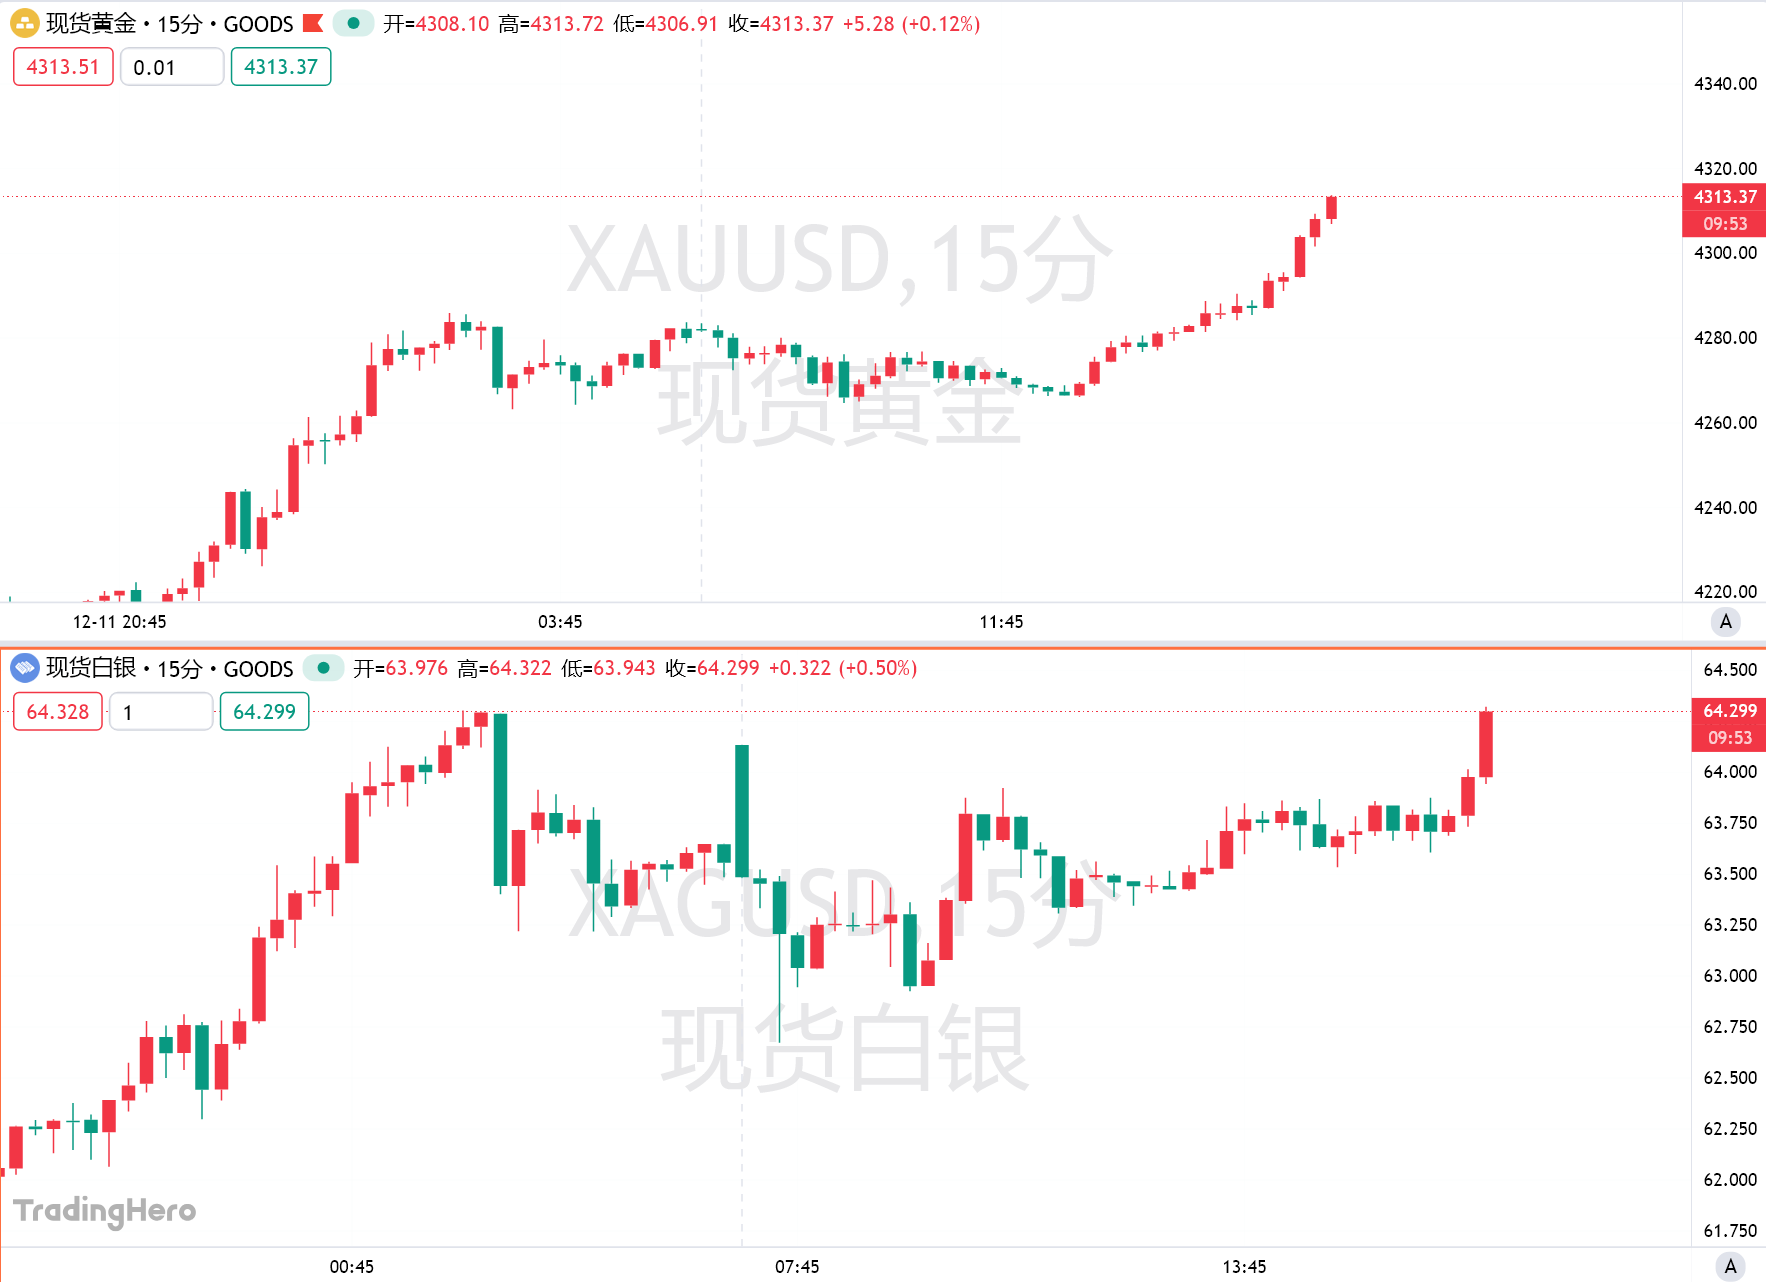
Gold surpasses the $4,310 mark—Is the "bull frenzy" returning?
Boosted by expectations of further easing from the Federal Reserve, gold has risen for four consecutive days. Technical indicators show strong bullish signals, but there remains one more hurdle before reaching a new all-time high.
Trend Research: Why Are We Still Bullish on ETH?
Against the backdrop of relatively accommodative expectations in both China and the US, which suppress asset downside volatility, and with extreme fear and capital sentiment not yet fully recovered, ETH remains in a favorable "buy zone."
