Date: Sat, April 12, 2025 | 05:30 PM GMT
The crypto market just wrapped up one of its toughest quarters in recent years. Ethereum (ETH) dropped 45%—its worst Q1 since 2018—and the ripple effect hit altcoins hard. DeFi giants like Aave (AAVE) and Uniswap (UNI) both saw over half their value erased in just a few months.
But after weeks of bleeding, there are early signs of life. Both AAVE and UNI are starting to form bullish reversal patterns on the charts, and they’re now approaching major resistance levels that could define their next move.
 Source: Coinmarketcap
Aave (AAVE)
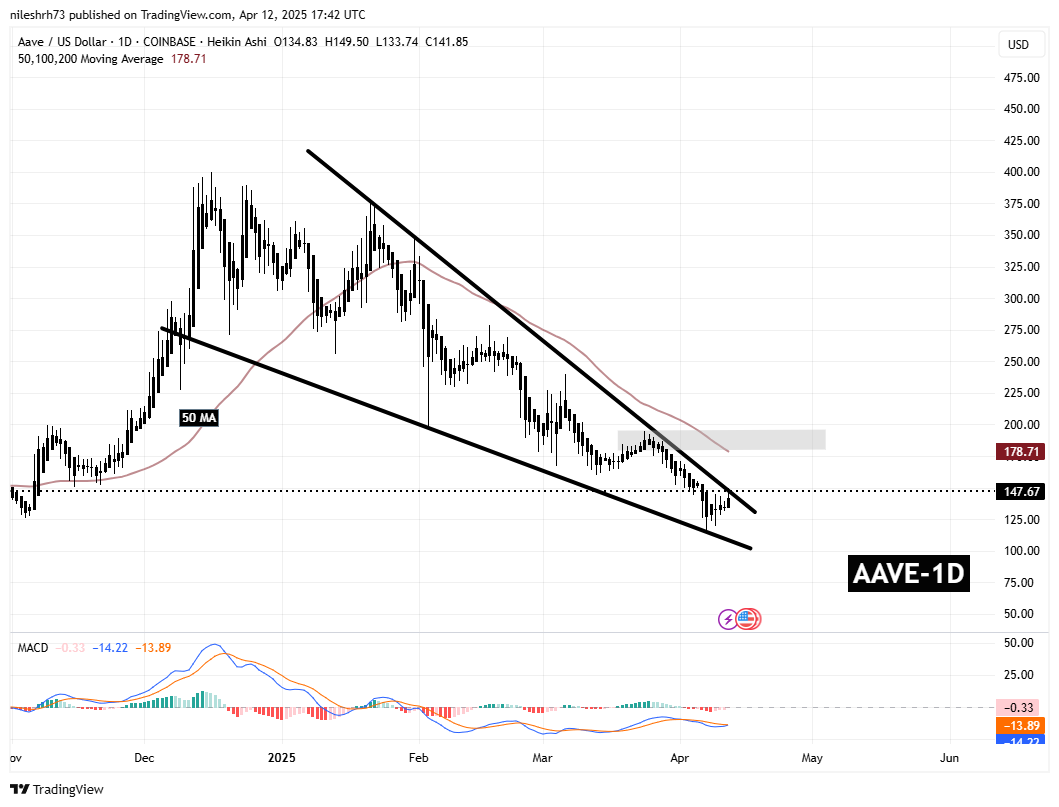
AAVE has been trading within a falling wedge pattern since rejecting the $400 level back in mid-December. The sell-off was sharp—more than 70%—bottoming out near $113 on April 7. That level attracted strong demand, with the price bouncing back to $147 in recent days.
 Aave (AAVE) Daily Chart/Coinsprobe (Source: Tradingview)
Now, AAVE is pushing up against the wedge’s upper boundary. If it breaks out and confirms with a retest, the next major target lies near the $194 zone and the 50-day moving average. That’s about 30% upside from where things stand today.
Uniswap (UNI)
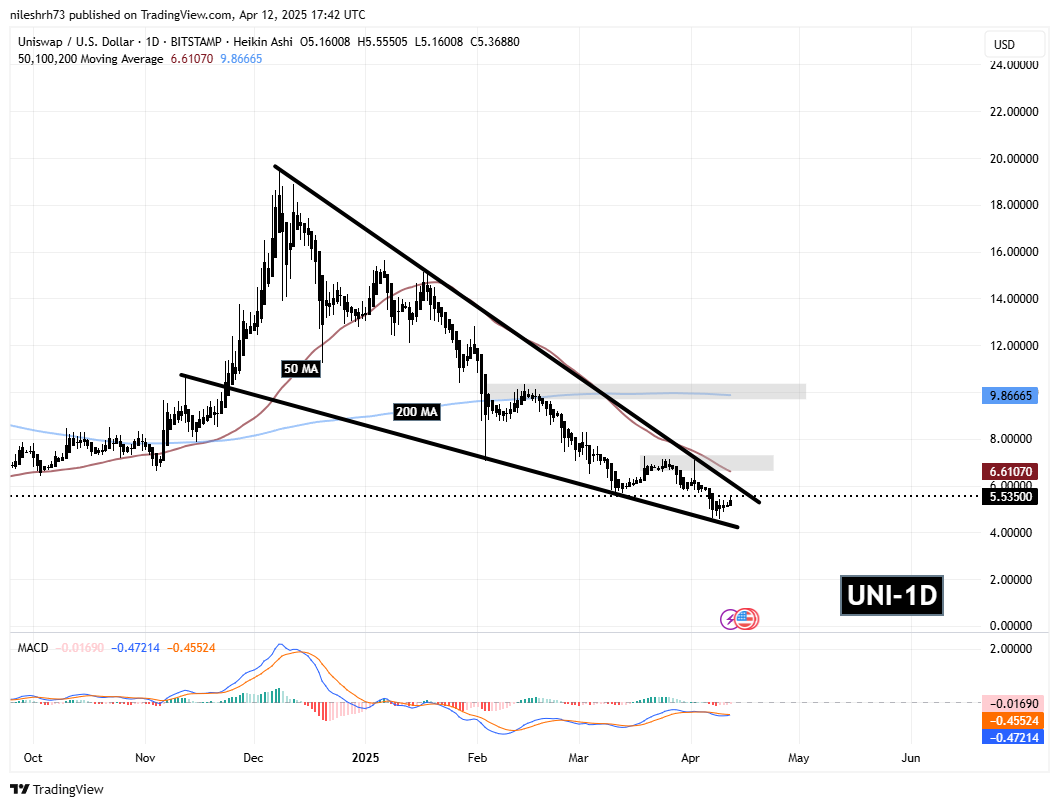
UNI’s chart is nearly a mirror of AAVE’s. After topping at $19.44 in early December, UNI slid more than 77%, hitting a low of $4.61 on April 7. Since then, it’s recovered to $5.53 and is pressing against the top of its own falling wedge.
 Uniswap (UNI) Daily Chart/Coinsprobe (Source: Tradingview)
A confirmed breakout here could propel UNI toward the $7.27 region, which lines up with its 50-day moving average. That would mark a solid 31% move higher from current levels.
What’s the Bigger Picture?
These wedge patterns on both AAVE and UNI are classic signs that bearish momentum might be fading. Add in rising volume and improving MACD indicators, and the setup for potential breakouts is clear.
But traders should stay cautious—if these resistance levels reject the move, both tokens could slip back into consolidation or even revisit recent lows.
Disclaimer: This article is for informational purposes only and not financial advice. Always do your own research before making any investment decisions.
