

Date: Wed, May 07, 2025 | 06:45 AM GMT
After a brutal Q1 where Ethereum (ETH) alone crashed 45%, the crypto market is finally showing signs of a comeback. ETH has bounced 31% from its April 9 low—and it’s not the only one. Stellar (XLM), one of the top altcoins , has surged nearly 27% over the last 30 days.
But XLM has cooled off recently, dropping more than 6% in the past week. So, is this just a healthy pullback—or the start of another bearish leg? A closer look at the chart may hold the answer.
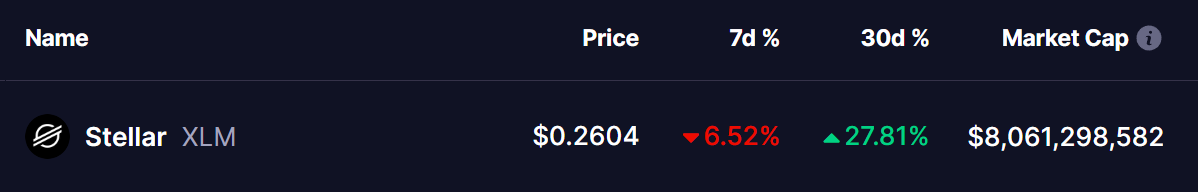 Source: Coinmarketcap
A Bullish Inverse Head and Shoulders Is Forming
On the daily chart, XLM is shaping up a textbook Inverse Head and Shoulders pattern—a classic signal of a potential bullish reversal. This pattern often suggests that selling pressure is weakening, and a trend reversal may be on the horizon.
Here’s the breakdown:
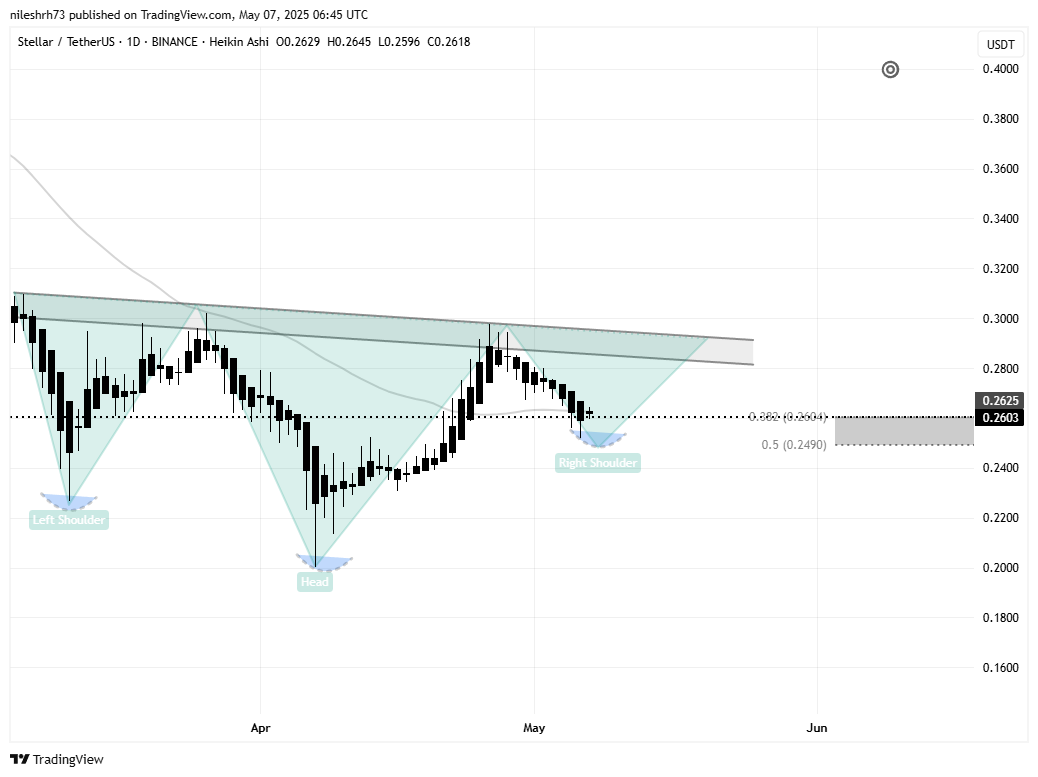 Stellar (XLM) 4H Chart/Coinsprobe (Source: Tradingview)
- Left Shoulder: XLM found support near $0.2268 in mid-March after getting rejected from the $0.3097 area.
- Head: The token then dropped to a low of $0.20 on April 7—marking the head of the pattern.
- Right Shoulder: Currently, XLM is hovering near the 0.382 and 0.5 Fibonacci retracement levels, with price stabilizing around $0.26.
What’s Next for XLM?
If this inverse head and shoulders pattern plays out, XLM could bounce from the current zone and move up to retest the neckline, which sits around $0.2836–$0.2930.
A confirmed breakout above $0.2930 would be key. That’s the neckline resistance zone that’s held XLM down for months.
Final Thoughts
Of course, patterns don’t guarantee outcomes. For the breakout to be valid, traders should look for volume confirmation, a clean candle close above resistance, and bullish momentum.
But so far, the structure is promising. If bulls reclaim control, Stellar might be preparing for a strong rebound.
Disclaimer: This article is for informational purposes only and not financial advice. Always conduct your own research before investing in cryptocurrencies.