

- MARA is showing a technical pattern that has formed since 2012 and may lead to a strong upside move.
- If the stock breaks above the resistance line near $28 it may trigger a move toward triple digits.
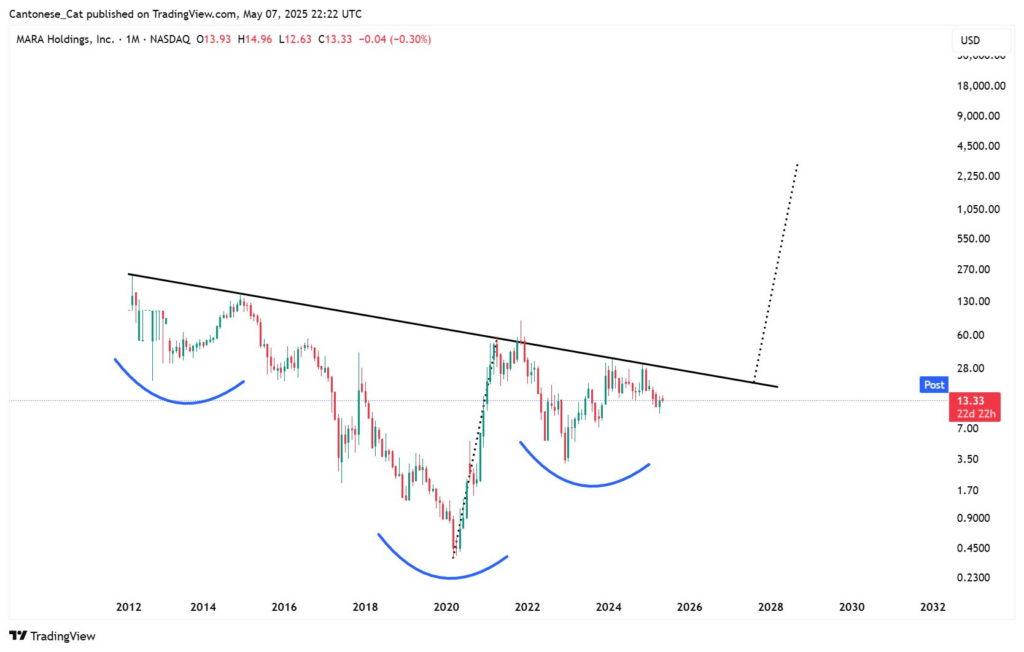
- The chart shows an inverted head and shoulders that supports a possible $3,000 target over several years.
Marathon Digital Holdings, Inc. (NASDAQ: MARA) is forming a potential long-term breakout pattern suggesting a move beyond $3,000 per share. A monthly chart shows a large inverted head and shoulders formation developing since 2012, with price currently near $13.33. This bullish structure points toward a possible breakout above long-standing resistance if confirmed by future price action.
 Source: X
The inverted head and shoulders spans over a decade, with key troughs marked around 2015, 2019, and 2023. Price action remains under a descending trendline, with multiple failed attempts to close above it since 2014. The projected target, once the neckline is breached, stretches well beyond current valuations.
Technical Pattern Signals Rare Long-Term Opportunity
The chart outlines an inverted head and shoulders pattern—a well-known reversal structure with high long-term relevance when confirmed. Each of the three major dips forms a symmetrical pattern, with rising volume and price support observed near each low. This alignment increases the validity of the setup.
MARA is currently priced at $13.33, trading just beneath the neckline resistance that extends from the 2014 high. A clean break above this line could complete the reversal and trigger the full target projection. The neckline, if surpassed with strong volume, transforms from resistance to new structural support.
The tweet accompanying the chart states that the target from this breakout would be “over 3,000.” While the number is striking, it reflects the full vertical range from the bottom of the pattern to the neckline. If this technical scenario plays out, it could mark one of the most extreme percentage gains seen in the equity market.
Historic Context Adds Weight to the Setup
Since its all-time high years ago, MARA has been in a long-term downtrend capped by the same resistance line shown in the chart. Every peak since 2014 has touched or neared this descending line, reinforcing its role as a major market boundary. That multi-year cap may now be tested again as buyers accumulate near current price levels.
Volume has shifted over recent years, with spikes near each bottom suggesting accumulation phases aligning with the head and shoulders structure. The most recent trough formed in 2023 mirrors prior lows in both depth and duration. Traders using long-term timeframes will be watching for a monthly candle close above the trendline.
The pattern suggests that if MARA can decisively clear resistance between $28 and $30, a move toward triple-digit territory becomes technically feasible. The move would not happen immediately but could unfold over several quarters or years. The dotted arrow on the chart hints at a steep potential rise once breakout confirmation occurs.
Could MARA’s Breakout Push It Beyond $3,000 in Coming Years?
The central question now is whether MARA can break its multi-year downtrend and execute this rare technical breakout. With price consolidating just below the neckline and forming symmetrical support, the conditions appear to be aligning. Investors and analysts will be watching closely for confirmation above the trendline.
The original post garnered over 34,000 views, revealing strong interest from traders speculating on long-term reversal patterns. The technical argument centers on structure, not speculation, with the inverted head and shoulders often seen in major reversal events. If the pattern confirms, the $3,000 target may not be out of reach.