

Date: Sat, May 10, 2025 | 04:58 AM GMT
The cryptocurrency market continues to build on its recent strength, with Bitcoin (BTC) and Ethereum (ETH) leading the charge. BTC has crossed the $103K mark, while ETH has soared more than 44% in the past 30 days, now trading above $2,300 — its highest level in months. This bullish wave is spilling into memecoins too, including Shiba Inu (SHIB).
SHIB is currently up over 6% today, pushing its monthly gain to an impressive 27%. Now trading near $0.00001511, the memecoin is showing strong bullish structure — and the chart hints at even more upside potential.
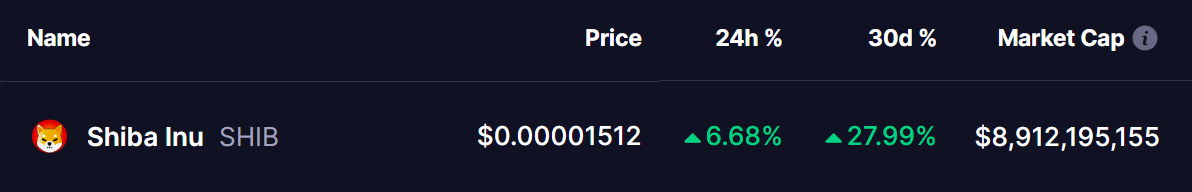 Source: Coinmarketcap
Inverse Head and Shoulders Pattern in Play
On the daily timeframe, SHIB is forming a textbook inverse head and shoulders pattern — a classic bullish reversal signal. This setup began in late February with the left shoulder, followed by a deeper dip in early April near $0.000010, forming the head. The recent right shoulder bounced off the 50-day moving average at $0.00001284, a critical support level that’s been holding firm.
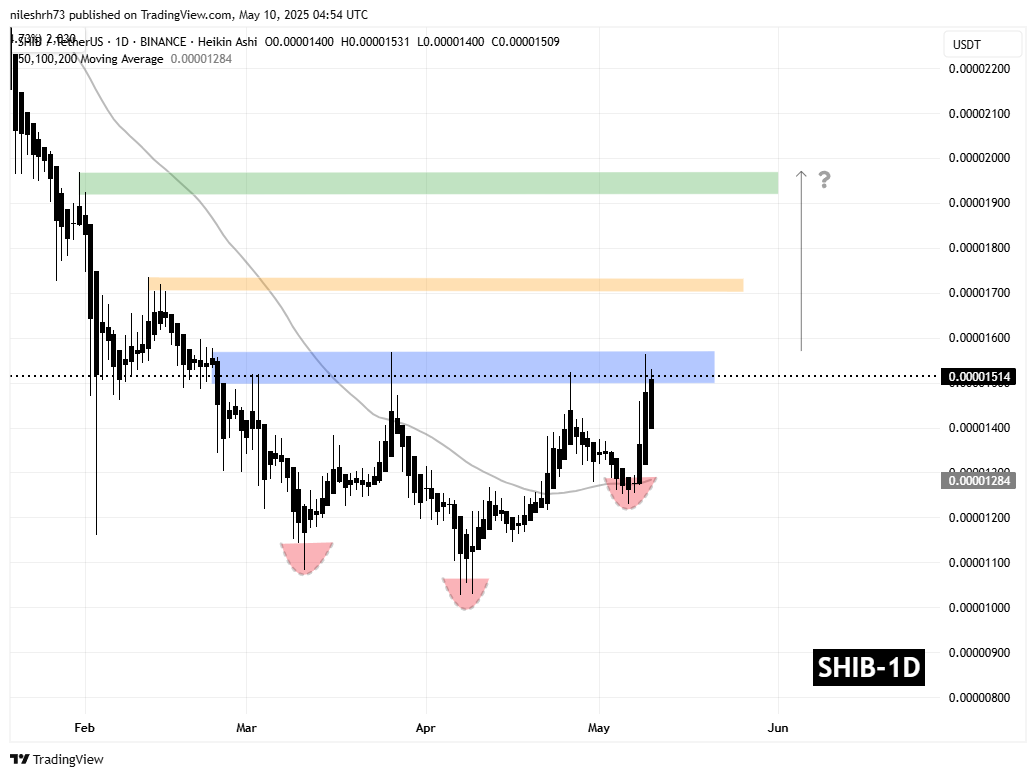 Shiba Inu (SHIB) Daily Chart/Coinsprobe (Source: Tradingview)
Price has now surged back to challenge the neckline resistance — marked by the blue zone on the chart — around $0.00001570. This area has acted as a ceiling multiple times over the past few months.
What’s Next for SHIB?
If bulls manage a clear breakout and daily close above the neckline, it would confirm the bullish reversal pattern — potentially setting the stage for a rally toward the yellow resistance zone at $0.00001734. That would represent a gain of roughly 14% from the current price.
Looking further ahead, a breakout above that could bring SHIB into the green resistance zone near $0.00001968 — offering over 30% upside from current levels. This region lines up with the price range SHIB last traded at during the March rally.
For now, all eyes are on the neckline. A rejection here could delay the rally, but the strong market momentum across memecoins— especially with Ethereum’s surge — gives bulls a fighting chance.
Disclaimer: This article is for informational purposes only and not financial advice. Always conduct your own research before investing in cryptocurrencies.