

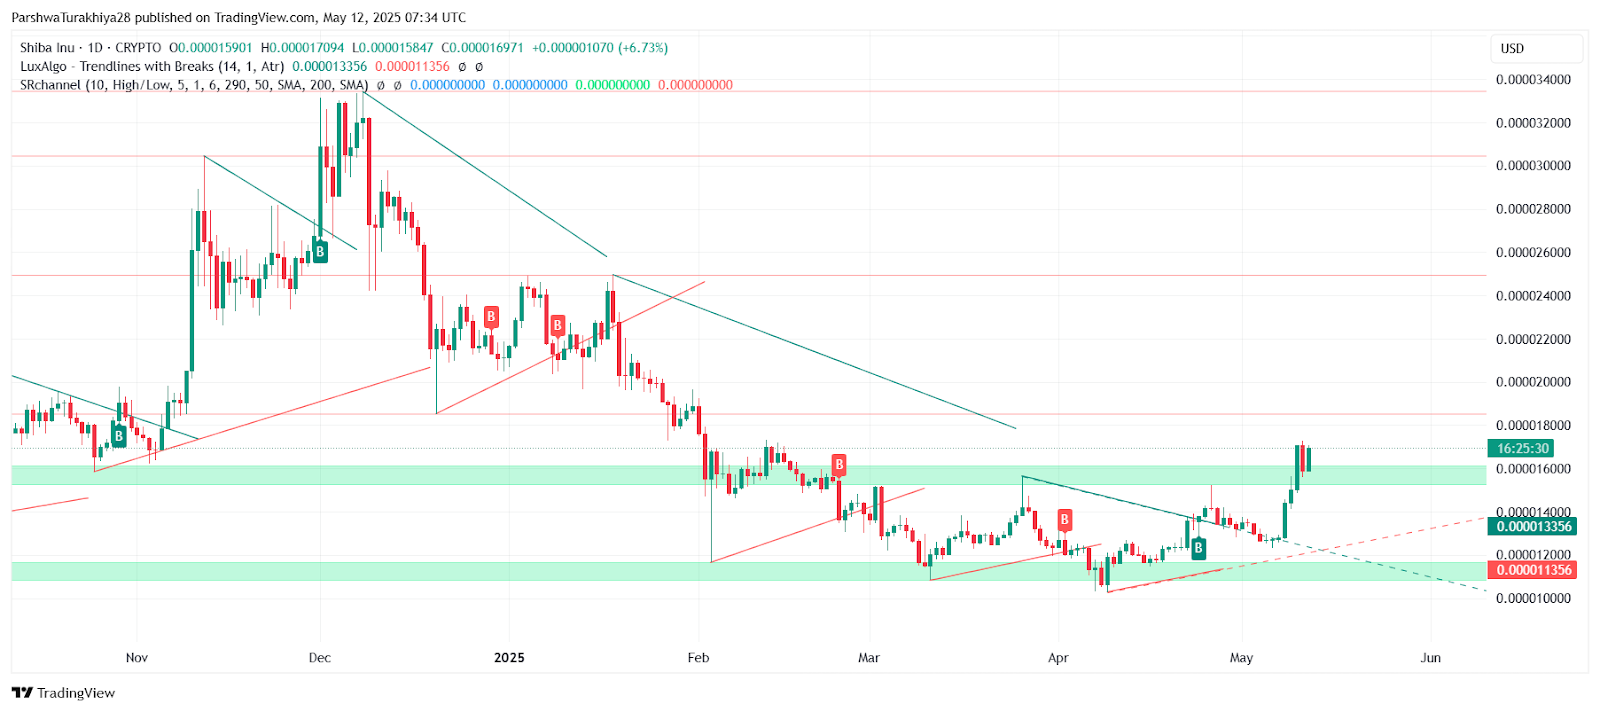
The Shiba Inu price today is trading near $0.00001690, reflecting a surge of more than 7% in the past 24 hours as bulls extended a breakout that began on May 9. This strong upside move comes after SHIB cleared a multi-week descending trendline and rallied past multiple resistance zones.
What’s Happening With Shiba Inu’s Price?
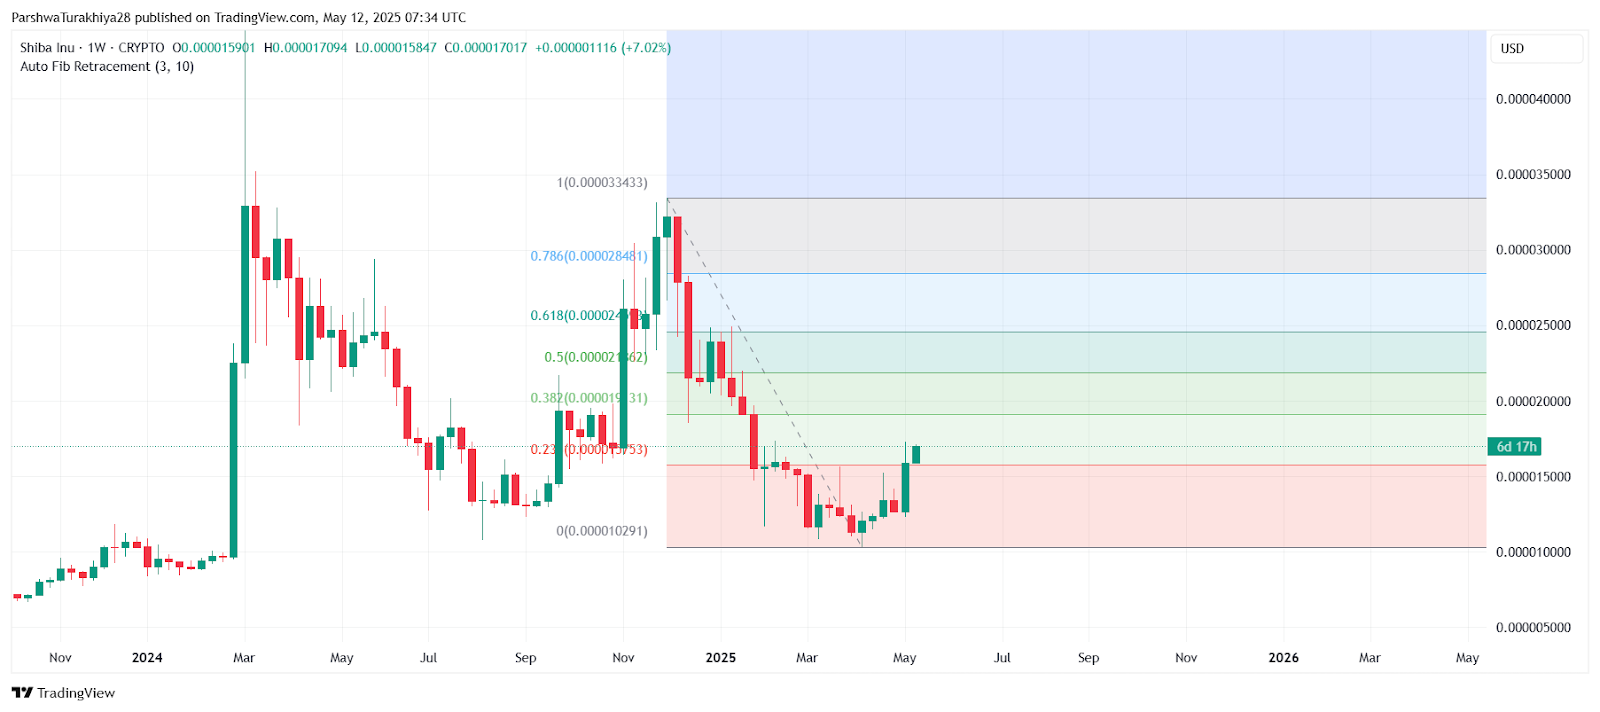 Shiba Inu price dynamics (Source: TradingView)
The daily chart reveals that SHIB has broken cleanly above the $0.00001600 barrier, which had previously acted as a major supply zone. The Shiba Inu price action confirms a bullish structure, forming higher highs and pushing toward the $0.00001750 resistance. If this level is decisively breached, the next major Fibonacci resistance lies at $0.00001850 and $0.00002026—coinciding with the 38.2% and 50% retracement levels from the 2024 high to 2025 low.
This Shiba Inu price update also shows growing bullish sentiment as SHIB’s daily candlesticks have formed strong-bodied green closes, supported by a sharp rise in trading volume and increasing momentum.
RSI, MACD and Bollinger Bands Signal Overheated But Positive Outlook
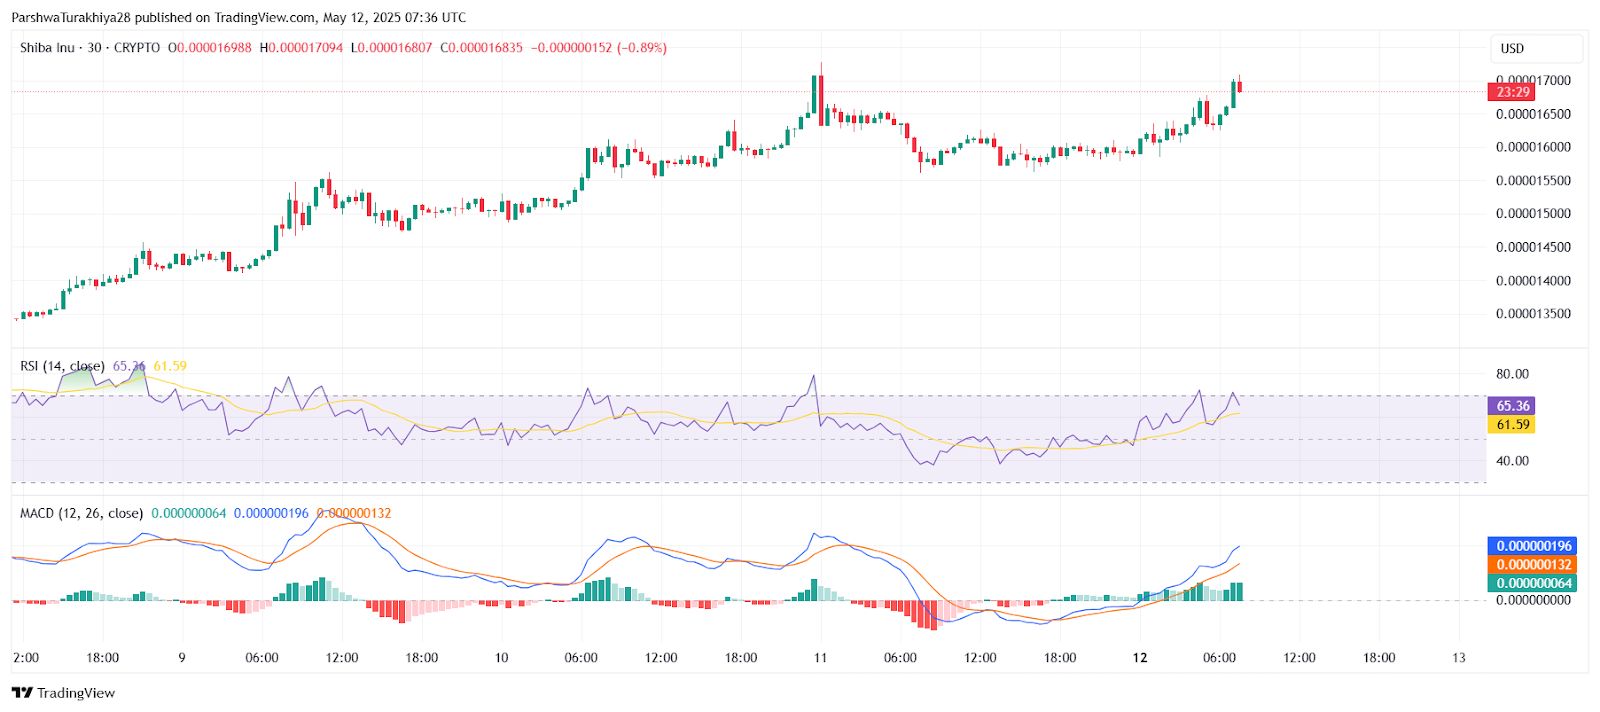 Shiba Inu price dynamics (Source: TradingView)
On the 30-minute and 4-hour charts, RSI is holding above 65, suggesting bullish momentum but also inching toward overbought territory. The 30-min RSI at 65.36 and 4-hour RSI around 70 show strong short-term buying, though further upside could face temporary resistance near $0.00001750.
Meanwhile, MACD remains bullish across intraday timeframes. The MACD lines have crossed upward on both the 30-min and 4-hour charts, with histogram bars expanding—signaling continuation of the short-term rally. The MACD line recently flipped positive for the first time since late April.
From a Bollinger Bands perspective, SHIB candles are riding the upper band on the 4-hour chart, which suggests a classic trend continuation. However, the gap between the bands is widening, a sign of Shiba Inu price volatility potentially peaking. This can often precede either consolidation or a retracement.
SHIB Breaks Out of Ichimoku Cloud and Finds Support at Key EMAs
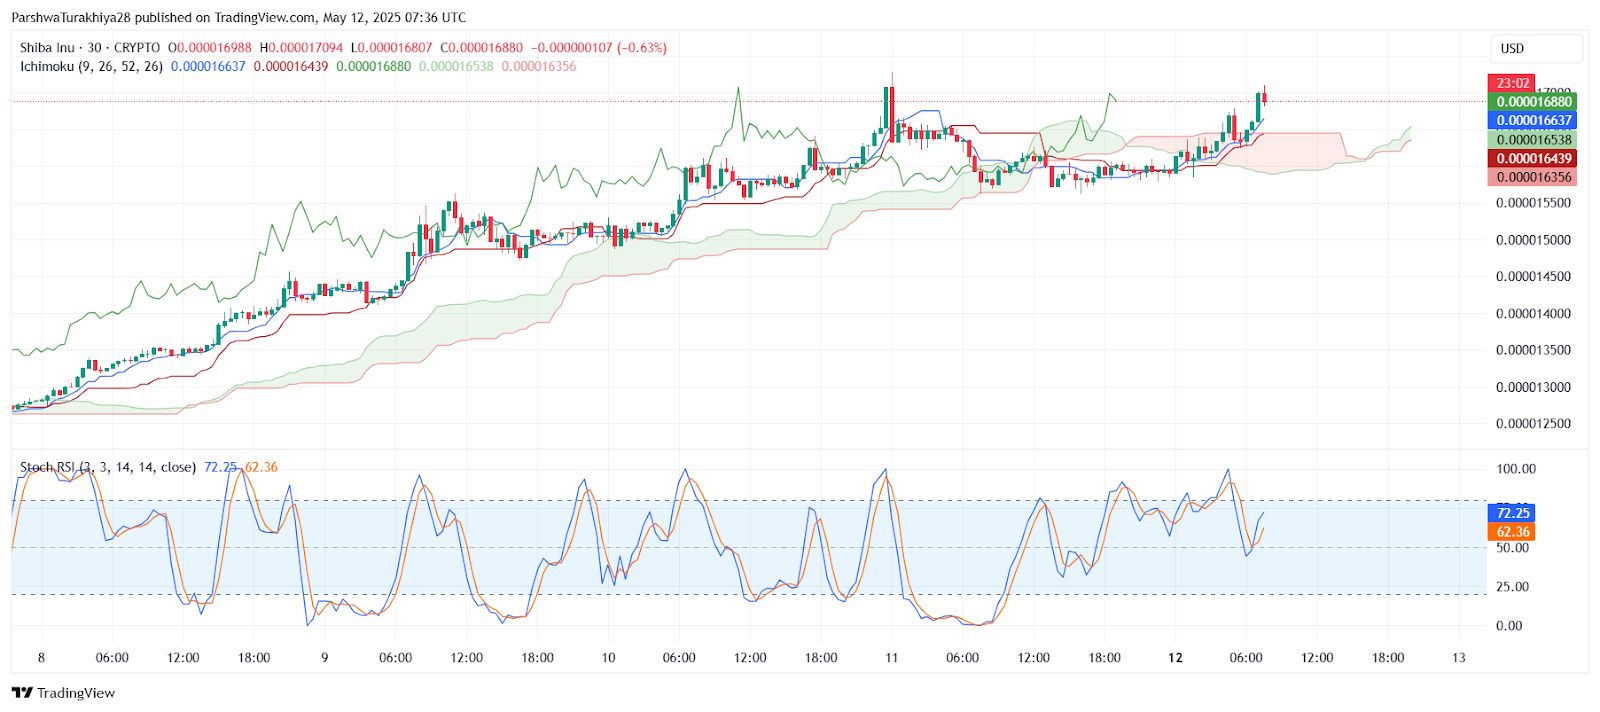 Shiba Inu price dynamics (Source: TradingView)
Another key factor in today’s Shiba Inu price spikes is the bullish break above the Ichimoku Cloud on the 30-minute chart. SHIB is now trading above all cloud components (Tenkan, Kijun, Senkou Span A/B), affirming bullish control over the trend.
 Shiba Inu price dynamics (Source: TradingView)
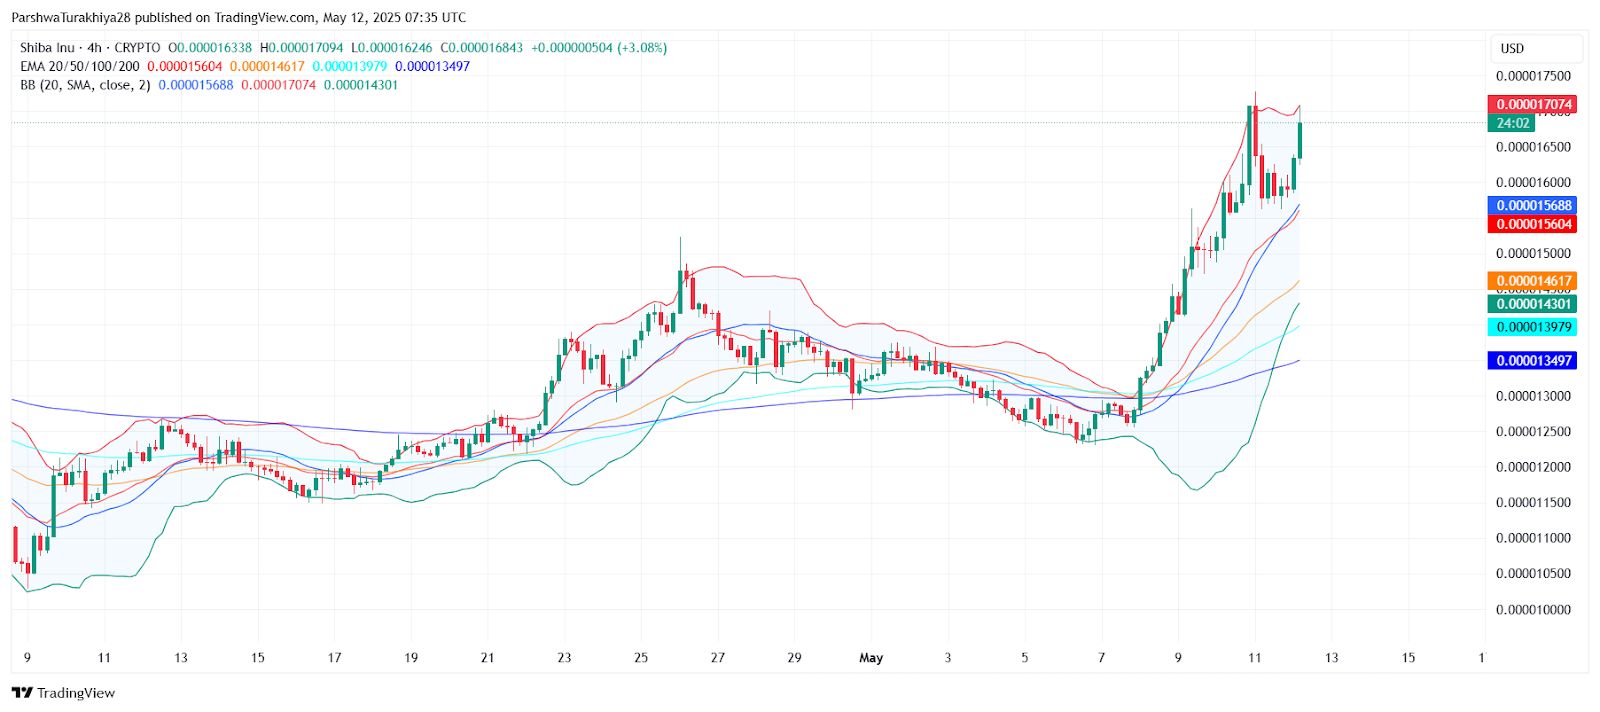
Moreover, on the 4-hour chart, SHIB is holding above all key EMAs (20, 50, 100, 200), with the 20 EMA at $0.00001560 and acting as dynamic support. This EMA stack continues to slope upward, reinforcing a bullish setup and providing a potential buy-the-dip zone if prices pull back.
The Shiba Inu price action also shows a potential continuation flag on lower timeframes, as the price consolidates near its highs. If bulls defend the $0.00001650 support, SHIB could stage another breakout heading into May 13.
Why Shiba Inu Price Going Up Today?
 Shiba Inu price dynamics (Source: TradingView)
The answer lies in a confluence of technical breakouts, increased meme coin speculation, and a renewed appetite for risk across altcoins. SHIB’s bullish reversal began with a trendline break and has been reinforced by a broader rebound in low-cap crypto assets.
With open interest in meme coins rising and SHIB capturing speculative attention, traders are likely positioning for further Shiba Inu price spikes into resistance zones. However, profit-taking near the $0.00001750 to $0.00001850 range may temporarily stall the rally.
SHIB Forecast Table (May 13 Outlook)
| Indicator/Level | Value/Signal |
| Current Price | $0.00001690 |
| Intraday Resistance | $0.00001750, $0.00001850 |
| Support Levels | $0.00001600, $0.00001560 |
| RSI (4H / 30-min) | 70.74 / 65.36 (Bullish) |
| MACD (30-min) | Bullish crossover |
| Ichimoku (30-min) | Breakout above cloud |
| EMA Support (4H) | 20 EMA at $0.00001560 |
| Volatility Outlook | High (Bollinger Bands Wide) |
Disclaimer: The information presented in this article is for informational and educational purposes only. The article does not constitute financial advice or advice of any kind. Coin Edition is not responsible for any losses incurred as a result of the utilization of content, products, or services mentioned. Readers are advised to exercise caution before taking any action related to the company.


