
Ethereum Eyes $3,000, But ETH Price Shows Key Resistance Ahead

Ethereum shows mixed signals after a strong rally, with momentum indicators cooling and resistance at $2,617 putting bulls to the test.
Ethereum (ETH) shows signs of strength and caution after a sharp 49% rally in the past week. While its market cap has returned above $300 billion and EMA indicators remain bullish, momentum indicators are starting to cool.
The ADX has dropped from 61 to 47.99, and RSI has fallen from 86 to 63, suggesting the uptrend may be losing steam. However, buyers are still active, and if ETH breaks above key resistance, the next leg higher could take it past $3,000.
ETH DMI Signals Cooling Rally and Rising Bearish Pressure
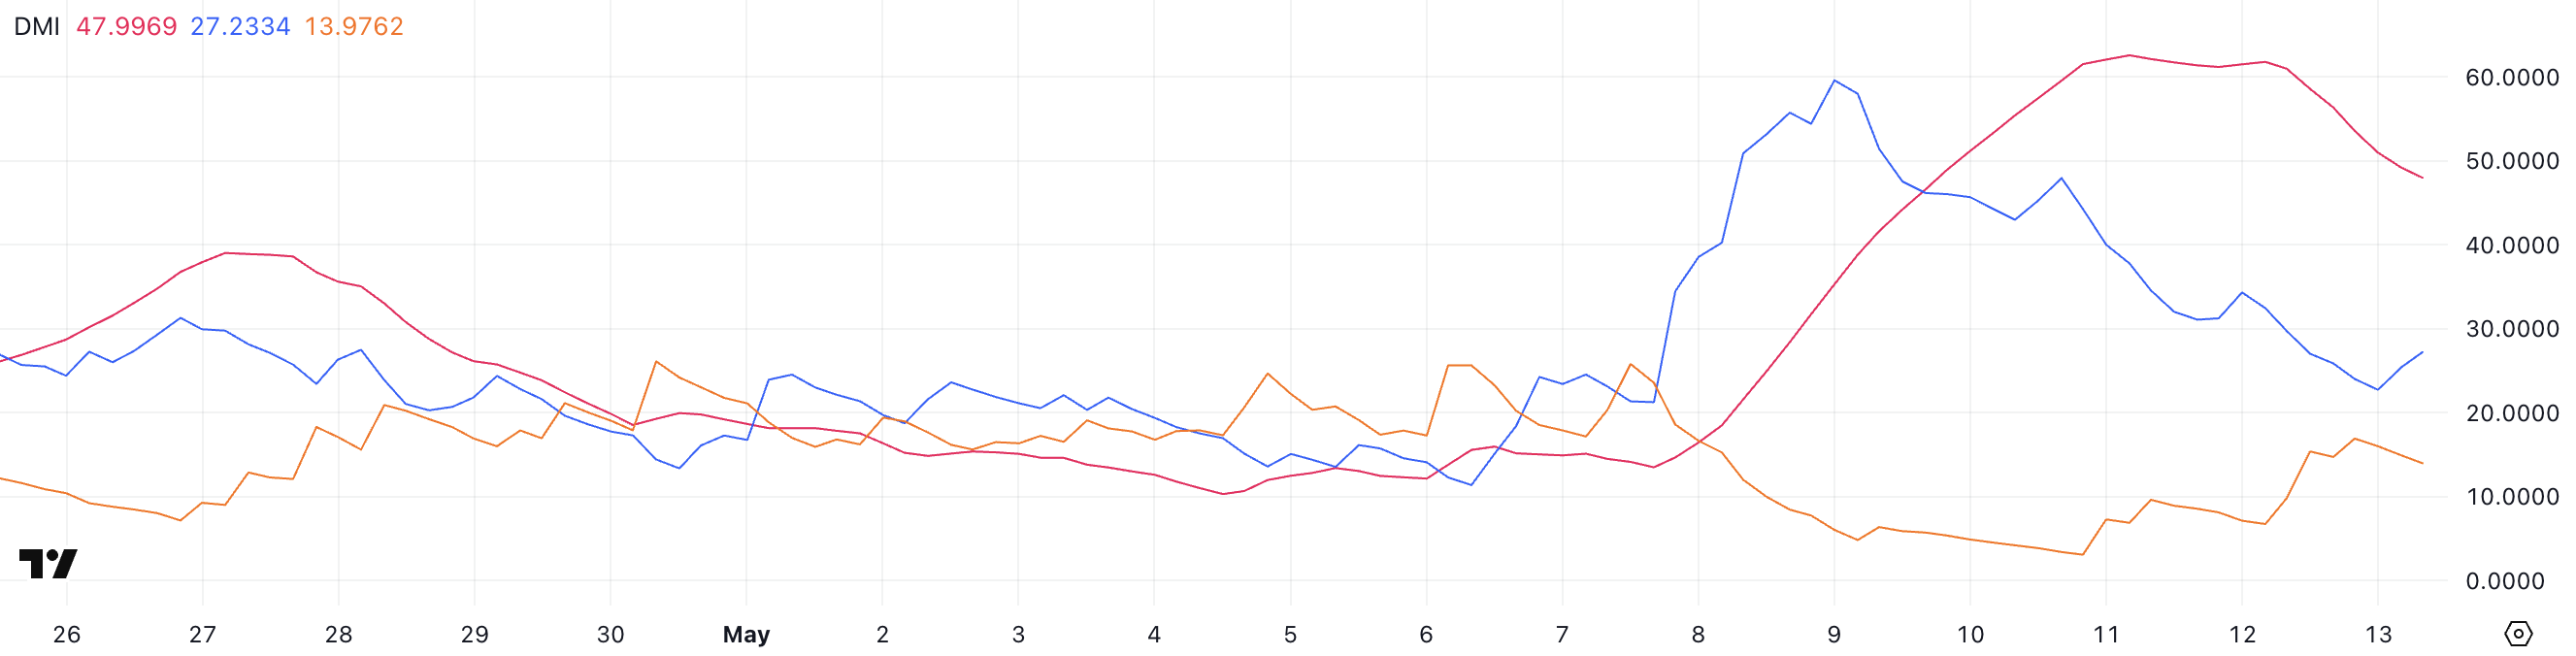
Ethereum’s DMI indicator shows that its ADX has dropped from 61 to 47.99, signaling a weakening trend strength.
The ADX (Average Directional Index) measures the intensity of a trend, with values above 25 indicating a strong trend and above 40 suggesting very strong momentum.
A declining ADX, even if still elevated, may indicate that the current trend is losing steam, despite analysts recently pointing out that Ethereum could overtake Bitcoin.
 ETH DMI. Source:
TradingView.
ETH DMI. Source:
TradingView.
The +DI line has fallen sharply from 47.96 to 27.2, showing that bullish momentum has cooled significantly.
Meanwhile, the -DI line has climbed from 3.39 to 13.97, suggesting that bearish pressure is starting to rise.
While the trend still favors the bulls, the gap between +DI and -DI is narrowing, and if this continues, Ethereum could face a short-term pullback or enter a consolidation phase. However, in the last hours +DI went up and -DI went down, suggesting ETH buyers are trying to maintain their control.
Ethereum RSI Cools From Overbought Zone but Remains Bullish
Ethereum’s RSI has dropped to 63 from a high of 86 three days ago, after holding above the overbought threshold of 70 for three straight days.
Interestingly, despite the recent dip, RSI has bounced from 54 just a few hours ago, suggesting some renewed buying interest in the short term.
 ETH RSI. Source:
TradingView.
ETH RSI. Source:
TradingView.
RSI (Relative Strength Index) is a momentum indicator that ranges from 0 to 100. Readings above 70 typically indicate overbought conditions and potential for a pullback, while readings below 30 suggest oversold conditions and a possible bounce. Values between 50 and 70 generally point to moderate bullish momentum.
At 63, Ethereum’s RSI shows that the asset has cooled off from recent overbought levels but still maintains underlying bullish strength. This could mean the market is resetting after a strong rally, allowing room for another leg up if buying continues.
Ethereum Eyes $3,000 After 43% Weekly Surge, But Key Resistance Holds
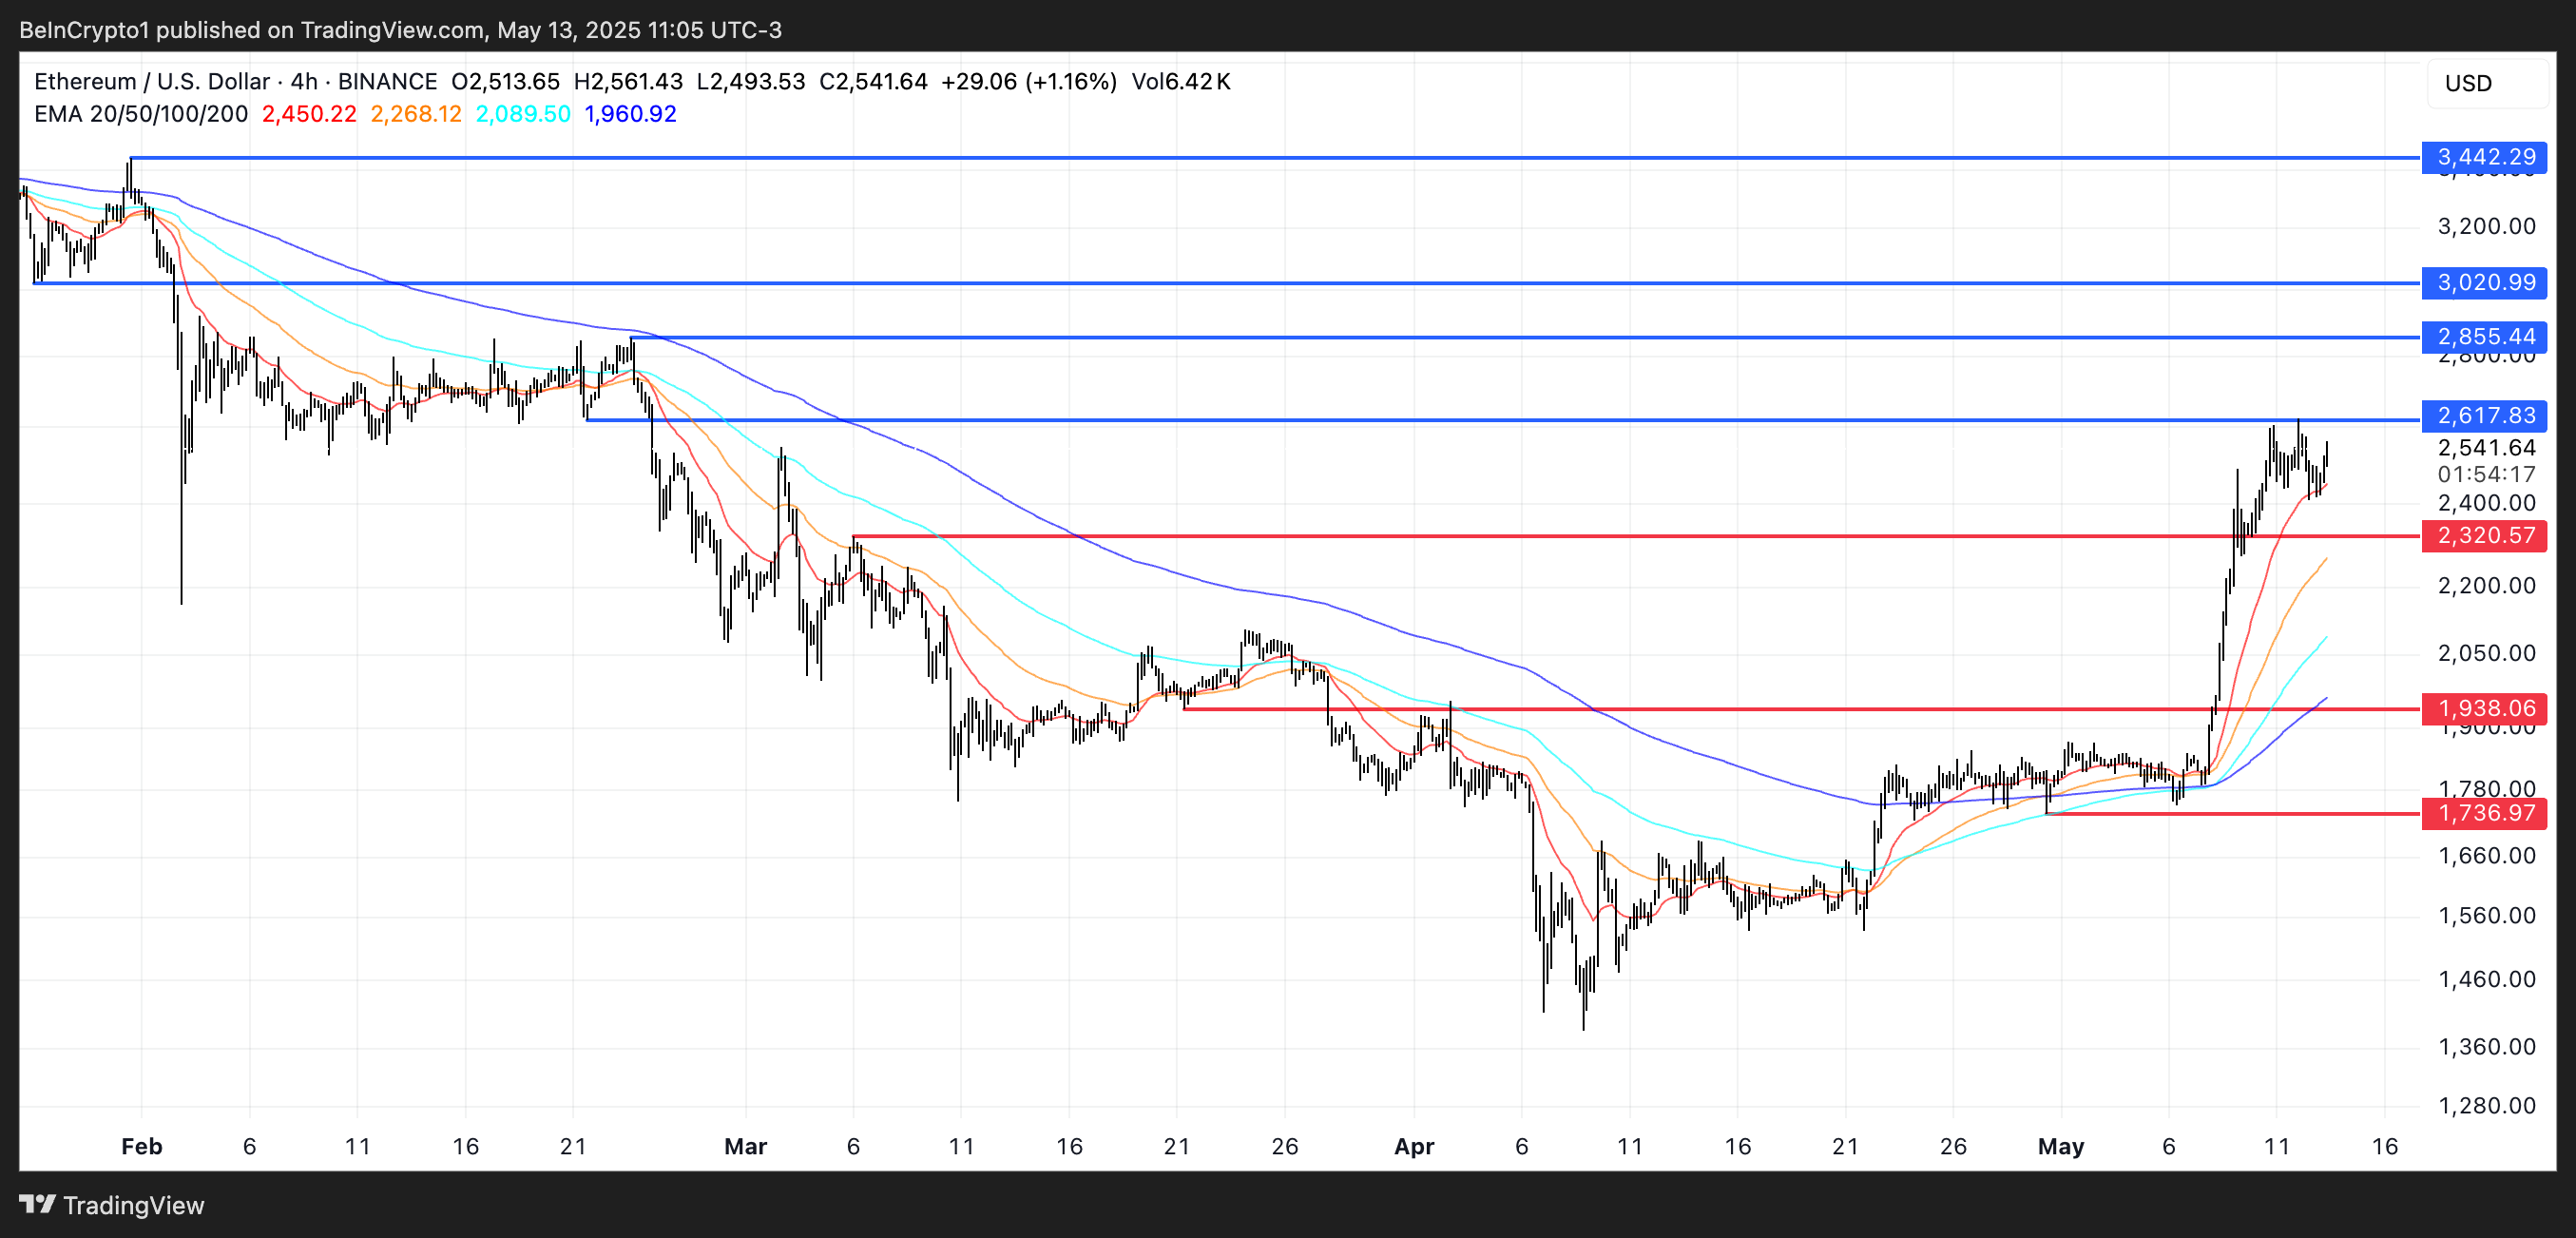
Ethereum price is up 43.5% over the past seven days, with its market cap climbing back above $300 billion. Its EMA lines continue to show a strong bullish structure, reinforcing the current uptrend.
However, ETH recently tested the $2,617 resistance and failed to break through.
 ETH Price Analysis. Source:
TradingView.
ETH Price Analysis. Source:
TradingView.
A successful breakout above that level could open the path toward $2,855 and even $3,000 for the first time since early February, with a possible extension to $3,442 if momentum accelerates.
On the downside, the $2,320 support is key. If ETH tests and loses that level, the price could slide to $1,938. A stronger bearish move might push it further down to $1,736.
Disclaimer: The content of this article solely reflects the author's opinion and does not represent the platform in any capacity. This article is not intended to serve as a reference for making investment decisions.
You may also like
No wonder Buffett finally bet on Google
Google holds the entire chain in its own hands. It does not rely on Nvidia and possesses efficient, low-cost computational sovereignty.
HYPE Price Prediction December 2025: Can Hyperliquid Absorb Its Largest Supply Shock?

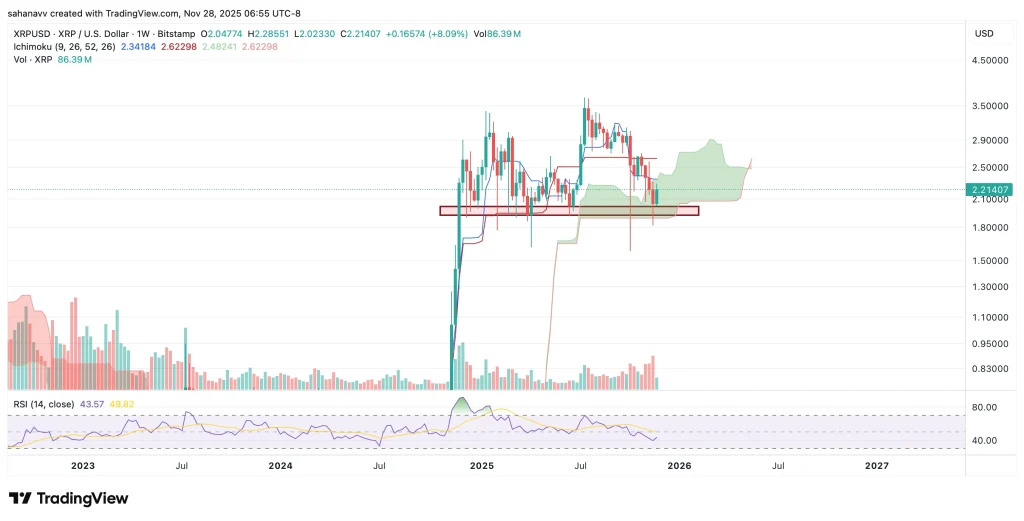
XRP Price Stuck Below Key Resistance, While Hidden Bullish Structure Hints at a Move To $3
Bitcoin Price Prediction: Recovery Targets $92K–$101K as Market Stabilizes