

- Dogecoin has broken out of a wedge pattern that previously led to price rallies near the $1 mark
- The current price movement follows the same chart setup seen before earlier parabolic moves in past cycles
- Analysts say the structure now targets $1 as long as momentum and trend remain strong through the coming weeks
Dogecoin may be targeting the $1 mark this season after forming a familiar breakout pattern on the weekly chart. A recent technical chart shared on May 15, 2025, shows DOGE repeating a parabolic structure last seen before its previous major rallies. The current trend signals momentum building toward a potential retest of long-term resistance.
 Source: X
Historical Patterns Show Repeated Breakouts
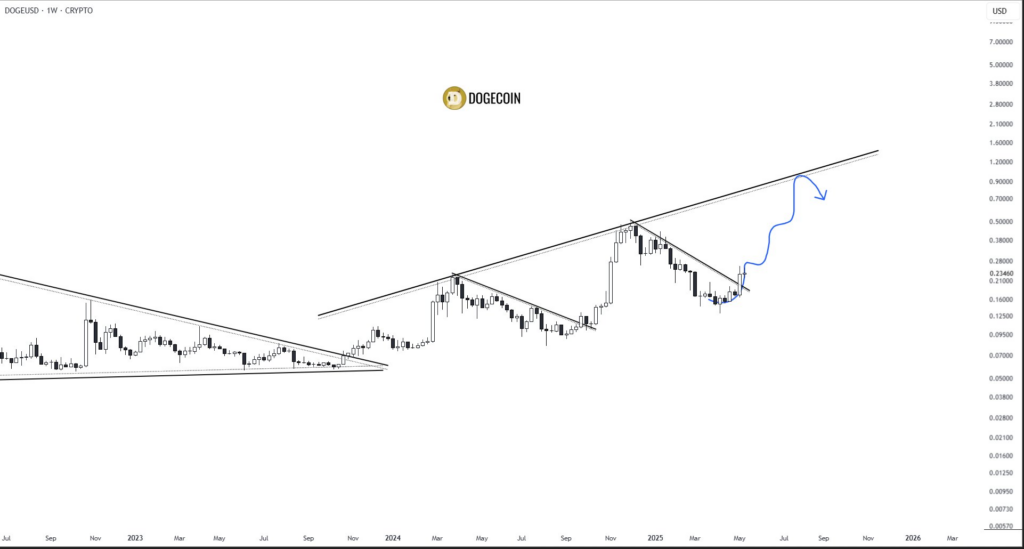
The chart, posted by analyst Anup Dhungana, reflects a consistent price structure forming over the past three years. Each bullish cycle begins with Dogecoin trading within a wedge pattern followed by a clean breakout and rally. The current formation closely mirrors past cycles, with another breakout now underway.
In 2023 and 2024, Dogecoin experienced this pattern twice before surging sharply. In both cases, price broke above descending trendlines before rallying to test upper resistance zones. The pattern is now forming again, signaling that history may repeat if market conditions hold.
Technical traders use such fractal formations to assess possible future movements based on historical behavior. The trendlines in the chart extend to the $1 level, where previous upward moves have reached before consolidation. A potential return to this zone is now being discussed widely within the crypto community.
Key Resistance Approaches as Momentum Grows
According to the latest chart structure, Dogecoin appears to be climbing toward the $1 resistance for a third time. This price level has acted as a major technical barrier in past cycles. The current setup suggests that price may test it again if momentum continues.
A parabolic trend is forming, marked by steep ascending price action after the breakout from the recent wedge. The weekly candlesticks are following a similar slope to previous rallies. Analysts believe that if price follows the projected path, $1 could be reached before a possible pullback.
The breakout follows a downward correction that began in early 2025. As Dogecoin reversed course, it broke the downtrend line and began to accelerate upward. This structural change has caught the attention of traders monitoring chart formations across major altcoins.
Can DOGE Maintain Its Trajectory to Reach $1?
The central question now being asked by market participants is clear: Can Dogecoin sustain momentum long enough to revisit $1?
The structure and scale of the chart suggest that if DOGE maintains its current pattern, another test of $1 is plausible. Previous breakouts took between eight and twelve weeks to reach the resistance zone from similar setups. The current pace suggests a similar timeframe may be unfolding again.
Price movement remains aligned with the projected curve seen on the technical analysis. If momentum continues and volume supports the trend, the $1 mark could be approached before Q3 2025. However, resistance at that level has triggered reversals before.