

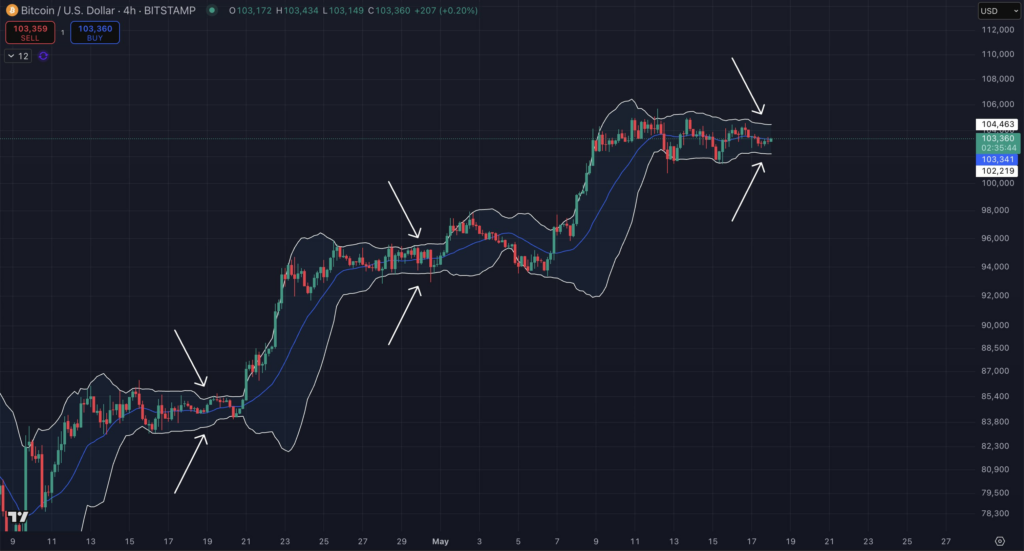
- Bitcoin’s 4-hour chart shows a tightening band setup near $103K that has previously led to large breakouts.
- Bollinger Bands are pressing close together again, which usually means the price may soon break with force.
- If BTC breaks past $104K then price could jump fast, but falling under $102K might retest the $100K zone.
Bitcoin (BTC) is trading around $103,360 on the 4-hour chart while Bollinger Bands show extreme tightening, suggesting a big move ahead. Historically, similar formations have led to significant breakout activity following a compression phase. This current setup points toward a potential directional shift in price, with volatility likely to increase soon.
 Source: X
According to the chart shared by chad.ventures, Bitcoin has entered another consolidation period where price action becomes more narrow. Tightening of Bollinger Bands often precedes explosive moves, either upward or downward. Observers are now watching closely as BTC moves within a tight range between $102,219 and $104,463.
Historical Pattern Signals Imminent Volatility
The visual representation of BTC’s 4-hour chart indicates several past instances where tight Bollinger Bands were followed by rapid price movements. Each arrow marks a moment of compression that led to a breakout. These past scenarios saw strong volume expansion and swift directional shifts.
Bitcoin’s recent movement mirrors similar formations seen earlier in May and April, where price traded flat before surging. The tightening of the bands occurs as price volatility reduces, and pressure builds within the consolidation channel. Once momentum is released, traders typically respond with increased trading activity.
The current range shows both upper and lower bands squeezing toward the price line. Historically, when bands contract this tightly, BTC tends to break with force. Market analysts often view this as a precursor to decisive action, especially when supported by volume confirmation and trendline interaction.
Consolidation Range Holds Key Levels
Bitcoin’s short-term support is set near $102,219 while resistance builds around $104,463. This narrow band forms the core of the compression zone where price is moving sideways. Each movement within this range is now crucial in determining the direction of the next breakout.
Multiple candles show rejection near the upper resistance without significant follow-through, suggesting a temporary supply zone. However, the support remains unbroken despite several minor dips. This combination indicates a strong neutral zone where neither buyers nor sellers currently dominate.
Traders are now focused on whether BTC will break above the resistance or slip beneath support. If the breakout occurs to the upside, levels above $105,000 may come into view quickly. A downside break could open the door to test previous support near $100,000 again.
Will the Next Move Mirror Past Breakouts?
The pattern now forming strongly resembles previous breakouts that triggered directional moves over $4,000 in short timeframes. Each time bands narrowed like this, BTC saw a sharp price reaction soon after. That level of volatility is again building as the chart setup compresses.
Bollinger Bands are used by many traders as volatility indicators that often precede market shifts. With compression now evident, the expectation for a breakout grows stronger. The question remains: will Bitcoin follow its historical pattern and break sharply from the current range, and in which direction will it unfold?