
Litecoin Price: $120 Next or Crash to $85?

Litecoin (LTC) price is flashing mixed signals as both bulls and bears battle around key support and resistance levels. After showing strength earlier in May with a rally above $100, LTC now trades at $96.01, caught in a tight range. Let’s break down the daily and hourly charts to understand where L TC price might go next —and whether a breakout or breakdown is imminent.
LTC Price Prediction: What Does the Daily Chart Say?
 LTC/USD 1 Day Chart- TradingView
The daily chart shows a clean uptrend that began in mid-April, where LTC price rallied from below $80 to touch a local high near $104 . On the way up, Litecoin successfully flipped its 50-day moving average (now at $96.60) into support. It even briefly crossed above the 200-day moving average (red line) which currently sits at $100.41.
But there’s a catch. LTC price has failed to hold above the $100 psychological resistance zone for more than a few sessions. The current Heikin Ashi candles are losing momentum, and we’re seeing a narrowing range between $94 and $101. This is a sign of indecision and often precedes a breakout.
The Fibonacci retracement from the April low to May high shows that Litecoin price is hovering around the 38.2% retracement level near $96 , which is acting as support. If LTC holds above this, the next leg up could test $104 again, followed by $112, which corresponds to the 1.618 Fibonacci extension.
Calculation Insight:
- May High: $104.
- April Swing Low: ~$74.
- Fibonacci 1.618 Target = $74 + ($104 - $74) * 1.618 = $122.54
This suggests that if momentum returns, a move toward $120–$125 is not out of the question. But that will require strong volume and a clean break above $104.
Hourly Chart: Is Litecoin Losing Momentum?
 LTC/USD 1 Hr Chart- TradingView
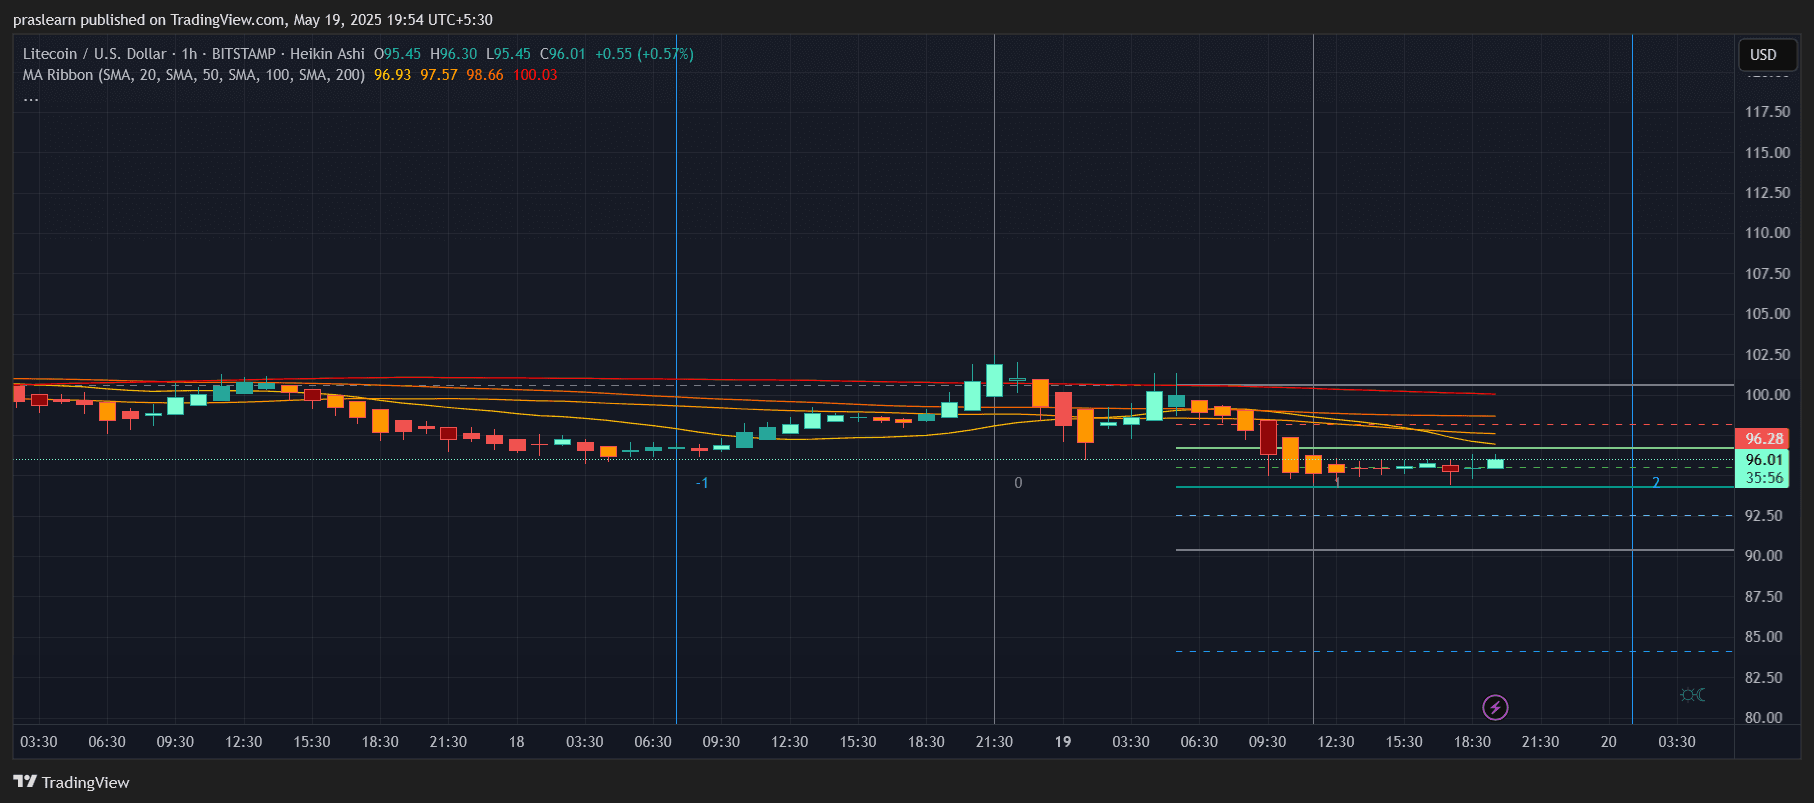
Zooming into the hourly chart, Litecoin price is currently trading below all major moving averages : 20, 50, 100, and 200 SMAs, which are now acting as a cluster of resistance around $97.50 to $100. This shows that short-term momentum has shifted in favor of sellers.
The recent bounce from $94 to $96.01 has been weak, with low volume and rejection at each resistance level. Moreover, the Heikin Ashi candles indicate indecision and slight bearish bias, marked by long upper wicks and small real bodies.
Unless LTC breaks and sustains above $98.66 (the 100-hour SMA), we could see another dip to test the $92 support level. A loss of $92 would open the gates to $88 and potentially $85.
What to Watch Next?
On the bullish side, the 50-day SMA is currently supporting the price. If this support holds and bulls reclaim $100, LTC price could attempt another breakout above $104, targeting $112 and potentially $120.
On the bearish side, failing to hold $94 may drag Litecoin toward $90 and then $85, especially if Bitcoin remains under pressure this week.
LTC Price Prediction: What’s Next for Litecoin Price?
Litecoin price is in a make-or-break zone. If LTC breaks above $100 with volume, it could target $112 and eventually $120 based on Fibonacci extension. However, if it fails to hold $94, then a pullback to $88–$85 becomes likely.
- Short-Term Prediction (This Week): Range-bound between $92–$100.
- Medium-Term Prediction (Next 10–15 Days): Bullish above $100, targeting $112–$120.
- Bearish scenario: Breakdown below $92 could trigger drop to $85
Keep an eye on the daily close relative to the 50-day and 200-day moving averages. They will likely decide whether LTC breaks out or breaks down.
Litecoin (LTC) price is flashing mixed signals as both bulls and bears battle around key support and resistance levels. After showing strength earlier in May with a rally above $100, LTC now trades at $96.01, caught in a tight range. Let’s break down the daily and hourly charts to understand where L TC price might go next —and whether a breakout or breakdown is imminent.
LTC Price Prediction: What Does the Daily Chart Say?
LTC/USD 1 Day Chart- TradingView
The daily chart shows a clean uptrend that began in mid-April, where LTC price rallied from below $80 to touch a local high near $104 . On the way up, Litecoin successfully flipped its 50-day moving average (now at $96.60) into support. It even briefly crossed above the 200-day moving average (red line) which currently sits at $100.41.
But there’s a catch. LTC price has failed to hold above the $100 psychological resistance zone for more than a few sessions. The current Heikin Ashi candles are losing momentum, and we’re seeing a narrowing range between $94 and $101. This is a sign of indecision and often precedes a breakout.
The Fibonacci retracement from the April low to May high shows that Litecoin price is hovering around the 38.2% retracement level near $96 , which is acting as support. If LTC holds above this, the next leg up could test $104 again, followed by $112, which corresponds to the 1.618 Fibonacci extension.
Calculation Insight:
- May High: $104.
- April Swing Low: ~$74.
- Fibonacci 1.618 Target = $74 + ($104 - $74) * 1.618 = $122.54
This suggests that if momentum returns, a move toward $120–$125 is not out of the question. But that will require strong volume and a clean break above $104.
Hourly Chart: Is Litecoin Losing Momentum?
LTC/USD 1 Hr Chart- TradingView
Zooming into the hourly chart, Litecoin price is currently trading below all major moving averages : 20, 50, 100, and 200 SMAs, which are now acting as a cluster of resistance around $97.50 to $100. This shows that short-term momentum has shifted in favor of sellers.
The recent bounce from $94 to $96.01 has been weak, with low volume and rejection at each resistance level. Moreover, the Heikin Ashi candles indicate indecision and slight bearish bias, marked by long upper wicks and small real bodies.
Unless LTC breaks and sustains above $98.66 (the 100-hour SMA), we could see another dip to test the $92 support level. A loss of $92 would open the gates to $88 and potentially $85.
What to Watch Next?
On the bullish side, the 50-day SMA is currently supporting the price. If this support holds and bulls reclaim $100, LTC price could attempt another breakout above $104, targeting $112 and potentially $120.
On the bearish side, failing to hold $94 may drag Litecoin toward $90 and then $85, especially if Bitcoin remains under pressure this week.
LTC Price Prediction: What’s Next for Litecoin Price?
Litecoin price is in a make-or-break zone. If LTC breaks above $100 with volume, it could target $112 and eventually $120 based on Fibonacci extension. However, if it fails to hold $94, then a pullback to $88–$85 becomes likely.
- Short-Term Prediction (This Week): Range-bound between $92–$100.
- Medium-Term Prediction (Next 10–15 Days): Bullish above $100, targeting $112–$120.
- Bearish scenario: Breakdown below $92 could trigger drop to $85
Keep an eye on the daily close relative to the 50-day and 200-day moving averages. They will likely decide whether LTC breaks out or breaks down.
Disclaimer: The content of this article solely reflects the author's opinion and does not represent the platform in any capacity. This article is not intended to serve as a reference for making investment decisions.
You may also like
Bitget donates HK$12 million to support fire rescue and reconstruction efforts in Tai Po, Hong Kong
Bitget Spot Margin Announcement on Suspension of ELX/USDT Margin Trading Services
Enjoy perks for new grid traders and receive dual rewards totaling 150 USDT
Bitget Spot Margin Announcement on Suspension of BEAM/USDT, ZEREBRO/USDT, AVAIL/USDT, HIPPO/USDT, ORBS/USDT Margin Trading Services