

After last week’s explosive surge, the Ethereum price today is trading near $2,558, reflecting a measured gain of 0.26% over the last 24 hours. Although buyers pushed ETH as high as $2,615 on May 20, the rally lost steam near a key resistance zone, leading to a mild pullback. With volatility tightening and lower-timeframe indicators flashing mixed signals, traders are now assessing whether bulls can maintain upward momentum or if a short-term correction looms.
Following this corrective pause, the broader question emerging is: Why Ethereum price going down today, and is this pullback just a breather within a bullish continuation or the start of a deeper retracement?
What’s Happening With Ethereum’s Price?
 ETHUSD price dynamics (Source:TradingView)
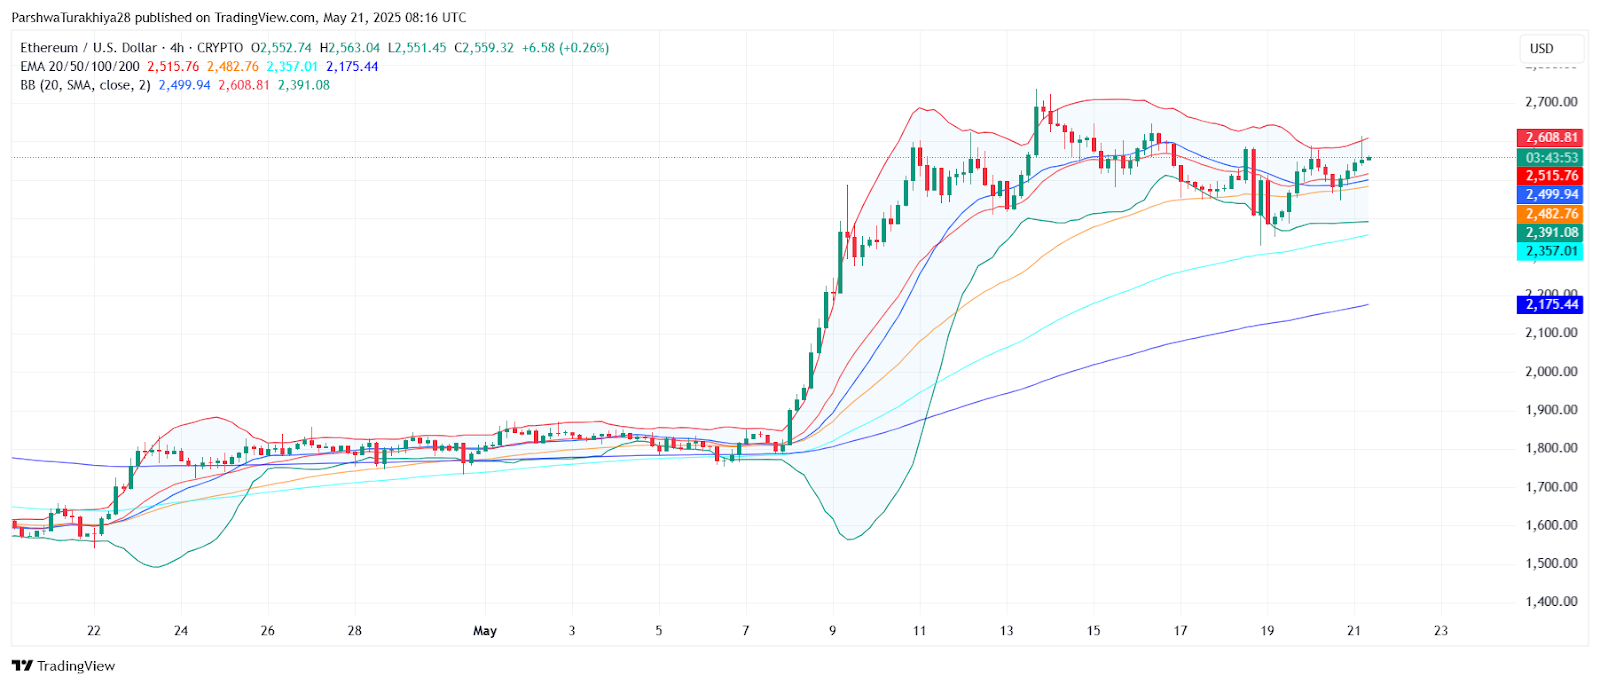
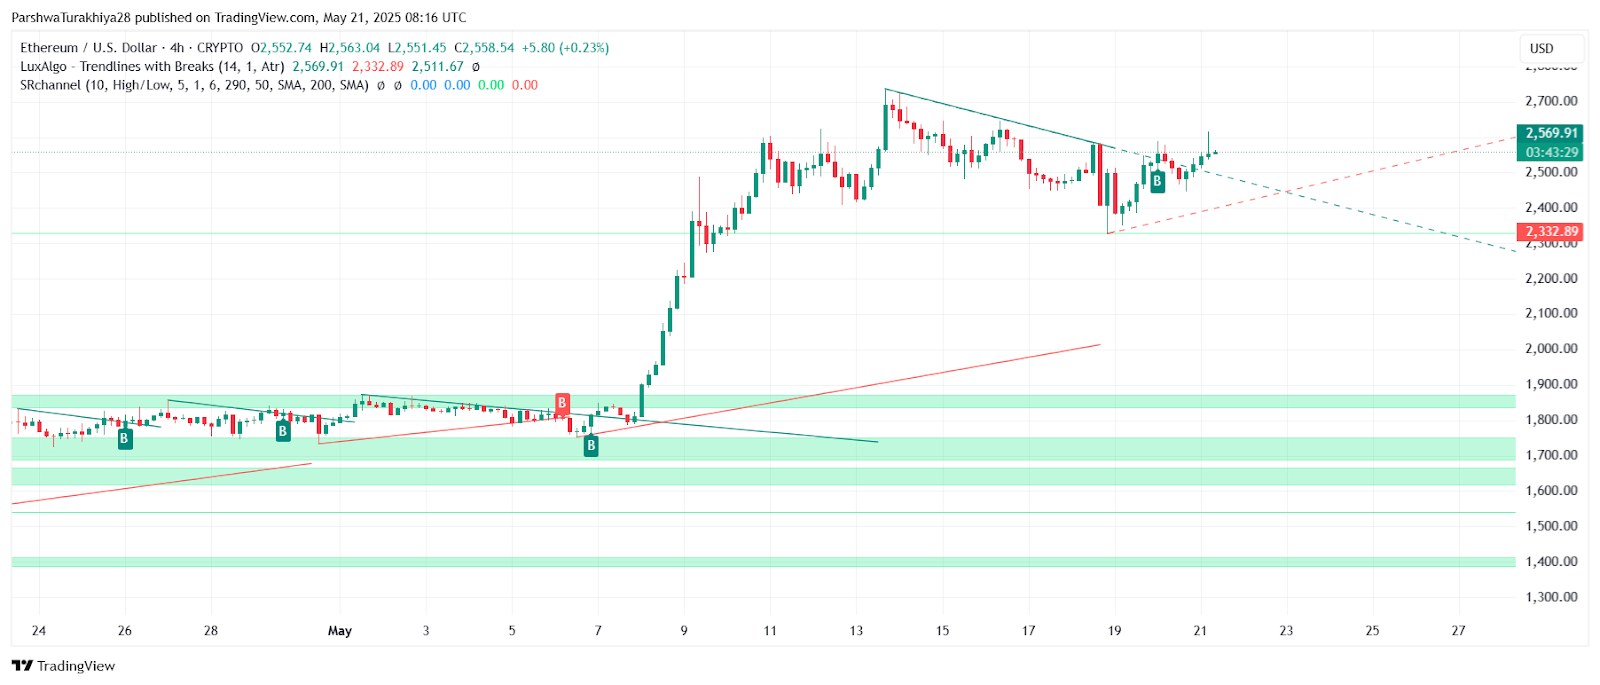
From a daily perspective, the Ethereum price action has remained bullish since reclaiming the $2,400 level in early May. The sharp breakout above the descending trendline and the reclaim of the 100-day EMA have now turned previous resistance into support. The daily structure shows ETH attempting to form a higher high pattern as it tests the upper boundary of the $2,580–$2,620 supply zone that capped upside during February.
 ETHUSD price dynamics (Source:TradingView)
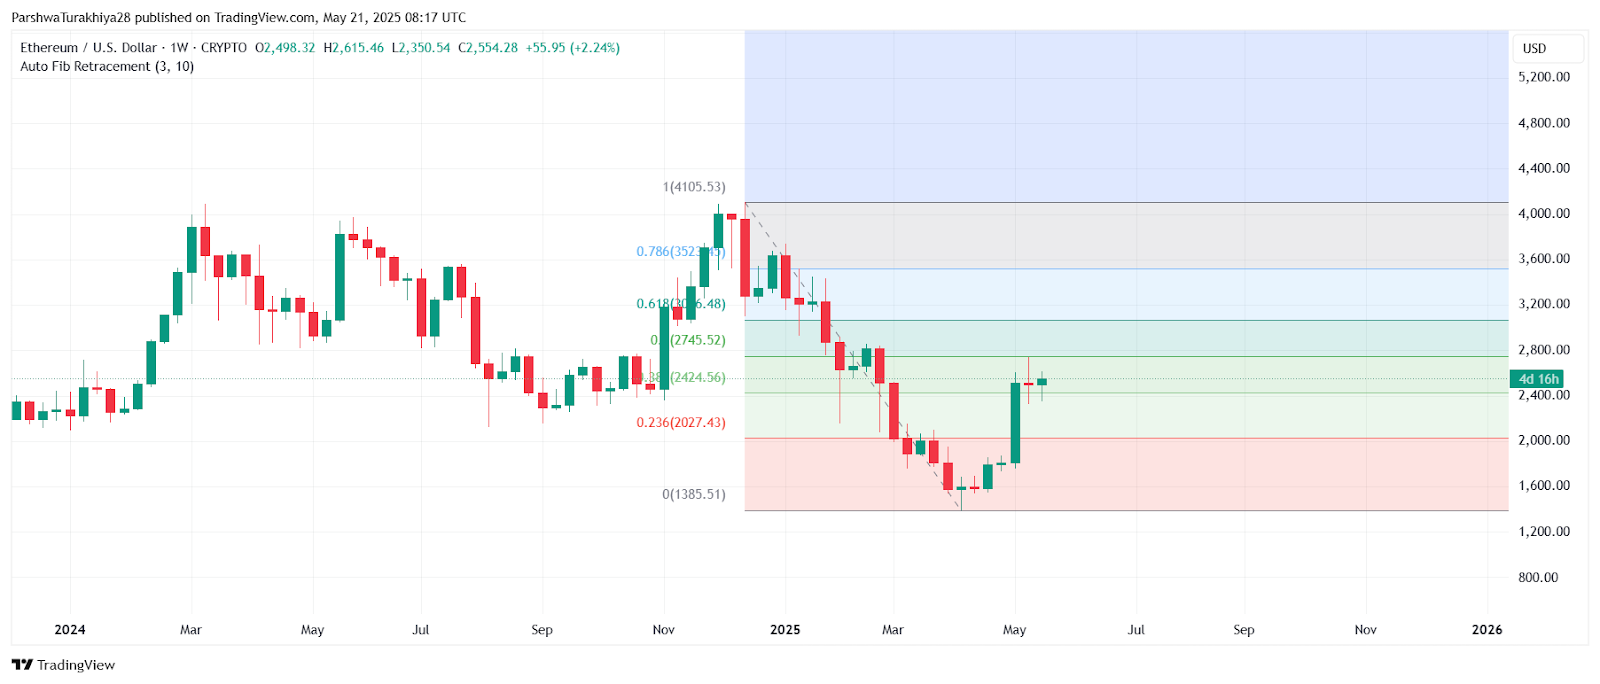
Looking at the weekly chart, ETH remains above the 38.2% Fibonacci retracement level near $2,424, with its next major resistance lying near $2,745 — the 0.5 Fib zone from the broader decline between November 2023 and March 2025. This confirms the ongoing recovery, although a break above $2,600 is still needed to confirm trend extension.
Ethereum Price Action Slows as RSI and MACD Diverge
 ETHUSD price dynamics (Source:TradingView)
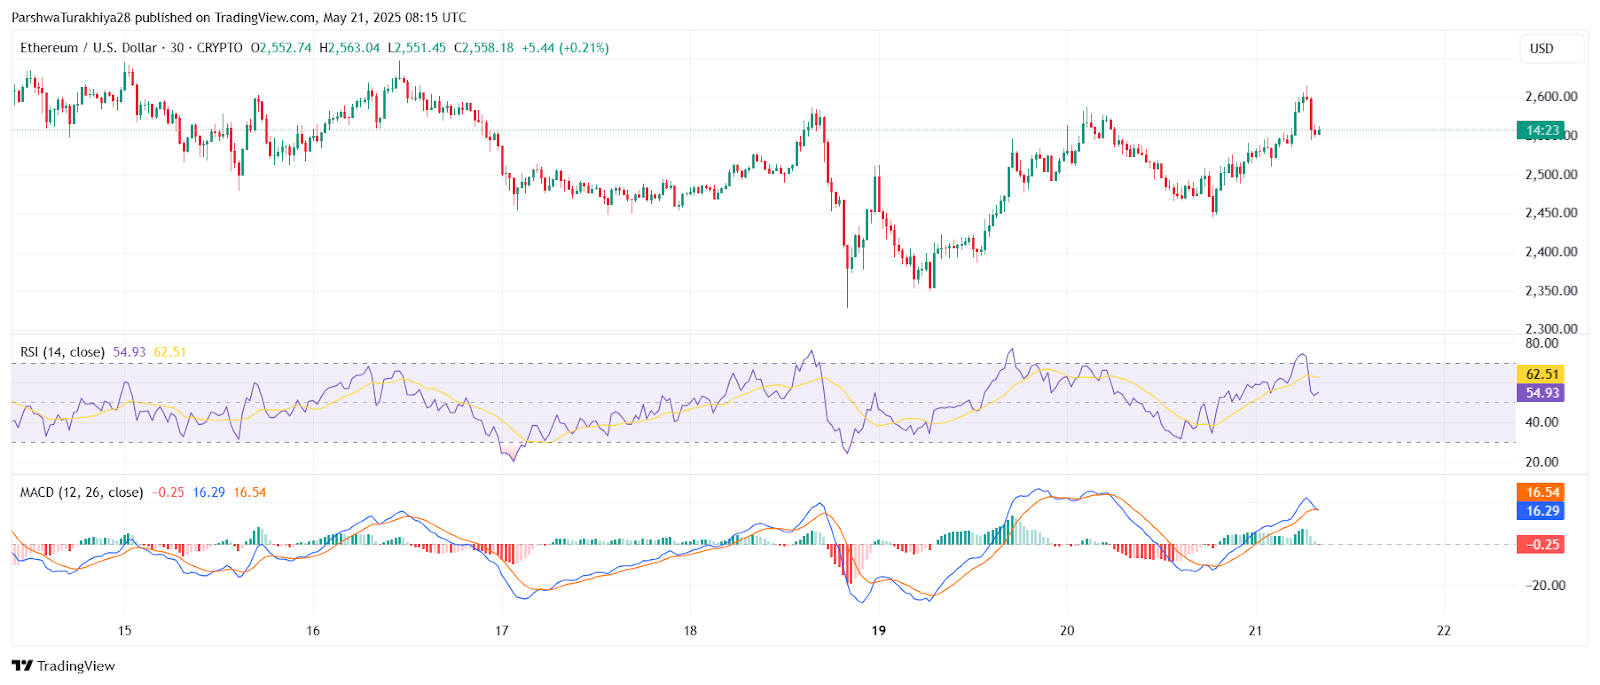
On the 4-hour chart, Ethereum price shows signs of consolidation following last week’s vertical rally. RSI has slipped from overbought territory to 54.93, reflecting fading momentum. Simultaneously, the MACD histogram is flattening, and the lines have begun to converge, pointing toward potential short-term indecision. While no bearish crossover is confirmed yet, the setup hints at caution.
 ETHUSD price dynamics (Source:TradingView)
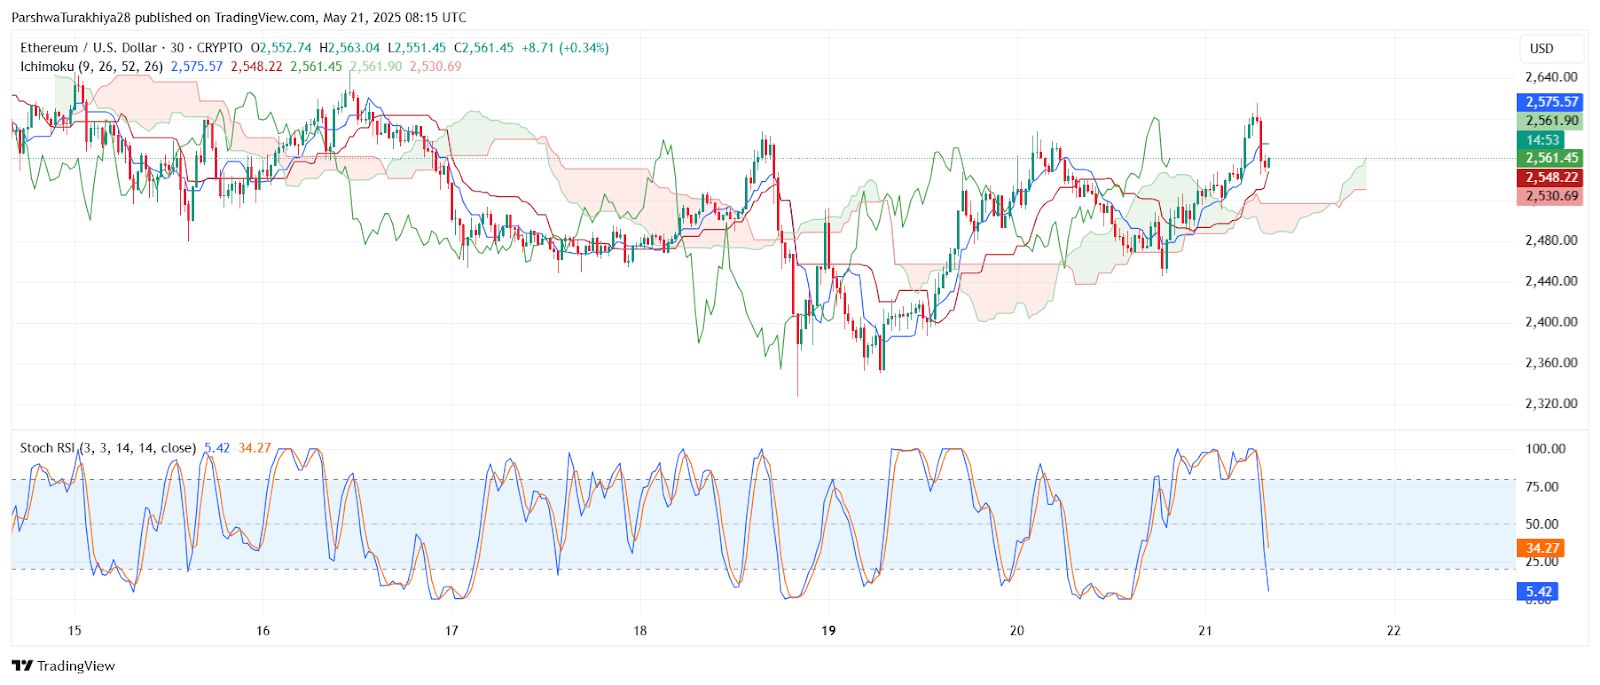
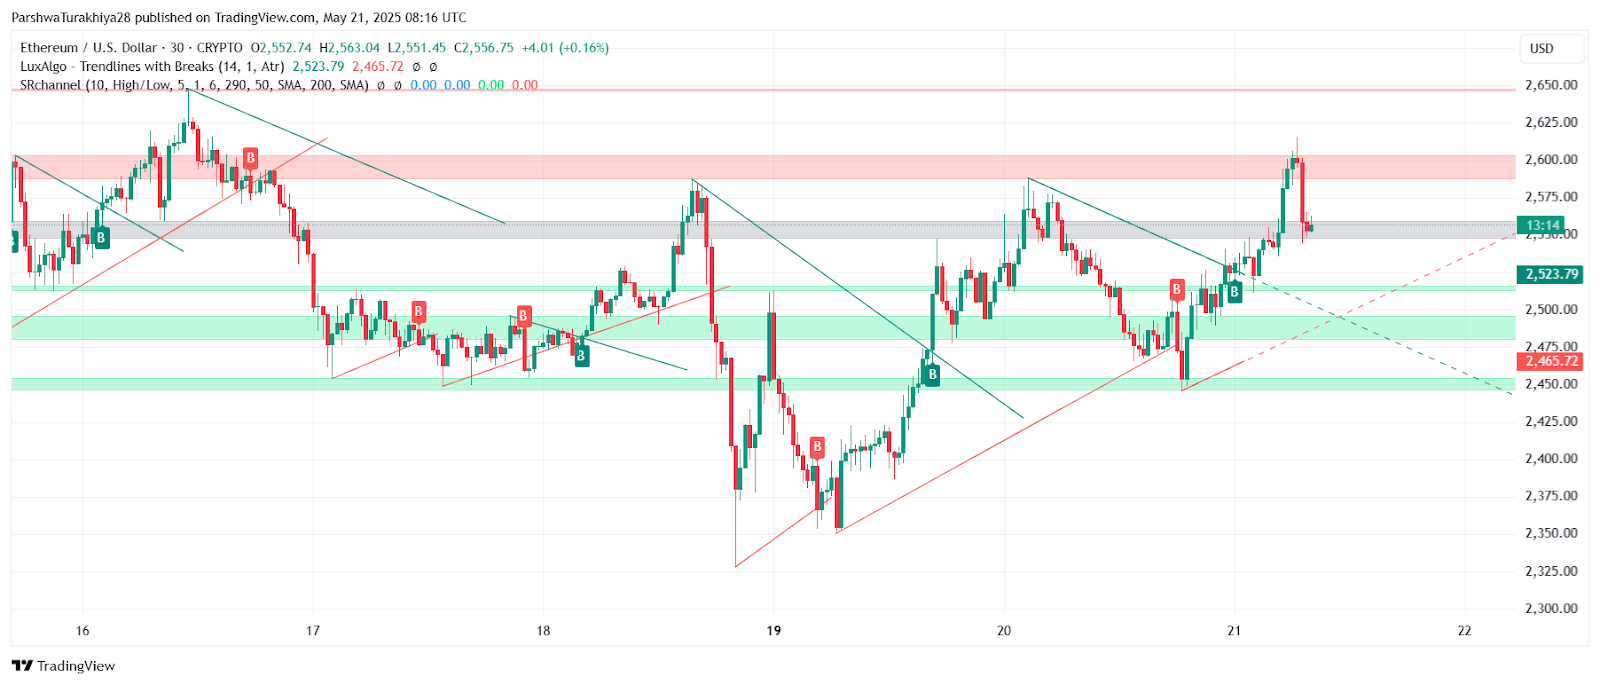
The 30-minute Stochastic RSI shows a sharper drop, with the blue line falling to 5.42, well into oversold territory. This could suggest that downside may be limited in the immediate term — especially if $2,520 support holds firm.
Bollinger Bands on the 4-hour chart are still expanding, signaling sustained Ethereum price volatility ahead. However, recent candles show rejection from the upper band, reinforcing resistance near $2,610. If price compresses further below this level, expect a volatility breakout by May 22.
Why Ethereum Price Going Down Today?
 ETHUSD price dynamics (Source:TradingView)
ETH faced sharp intraday rejection from $2,615, which coincides with a historically reactive resistance zone. The move also aligned with the top of the Bollinger Band on the 4H chart and the top boundary of the Ichimoku cloud on the 30-minute timeframe — both strong reversal triggers in short-term trading systems.
Adding to this, the Stoch RSI on lower timeframes suggests overbought exhaustion, with a swing low setup forming around $2,530. With speculative longs unwinding, the Ethereum price update shows minor but notable pressure on the upside.
Despite this, the broader structure remains bullish. The key now lies in whether bulls can absorb selling pressure around $2,520–$2,530 and reclaim $2,580 in the next 24 hours. A failure to defend $2,520 could invite deeper tests toward the $2,465–$2,475 demand zone.
Ethereum Price Forecast for May 22: Can $2,600 Be Reclaimed?
 ETHUSD price dynamics (Source:TradingView)
If bulls can successfully flip the $2,580–$2,600 region into support, the path toward $2,745 (Fib 0.5) remains open. Beyond that, $2,850 and $3,000 would be the next natural targets — both psychologically and structurally.
However, failure to defend $2,520 could result in a dip to $2,465 and potentially $2,424 (Fib 0.382), where significant accumulation occurred during last week’s rally. The Ichimoku cloud base and Bollinger midline on the 4H also sit around this zone, making it a critical support region.
Until then, price may remain range-bound between $2,520 and $2,600. Traders should monitor RSI behavior around 50 and MACD crossovers for signs of breakout or breakdown confirmation.
ETH Technical Forecast Table: May 22
| Indicator/Zone | Level (USD) | Signal |
| Resistance 1 | 2,615 | Near-term rejection zone |
| Resistance 2 | 2,745 | Fib 0.5 breakout target |
| Support 1 | 2,520 | Short-term bullish defense line |
| Support 2 | 2,465 | Structure + cloud bottom |
| RSI (4H) | 54.93 | Neutral to mild bullish |
| MACD (30-min) | -0.25 | Flattening |
| Stoch RSI (30-min) | 5.42 | Oversold |
| Bollinger Band Width | Expanding | Volatility brewing |
Disclaimer: The information presented in this article is for informational and educational purposes only. The article does not constitute financial advice or advice of any kind. Coin Edition is not responsible for any losses incurred as a result of the utilization of content, products, or services mentioned. Readers are advised to exercise caution before taking any action related to the company.