

Date: Thu, May 29, 2025 | 09:15 AM GMT
The cryptocurrency market has staged an impressive rebound this quarter, with Ethereum (ETH) leading the charge. After climbing over 49% in Q2, ETH is now trading above $2,700—a level last seen in February. This renewed bullish sentiment is not just limited to ETH. It’s lifting altcoins across the board, including Quant (QNT).
QNT has gained impressively over 52% in the last 30 days. While this rally alone is a strong sign of bullish interest, technical analysis suggests the token might be on the verge of a major breakout.
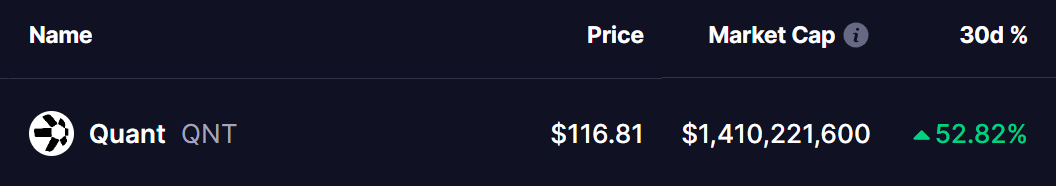 Source: Coinmarketcap
Approaches a Classic Rounded Bottom Resistance
On the daily chart, QNT is displaying a textbook rounded bottom formation — a bullish reversal pattern that often signals the end of a prolonged downtrend and the start of a new upward phase.
As shown in the chart, the pattern began forming after a sharp rejection from the neckline resistance around $123 in mid-January. That rejection sparked a deep correction of 53%, dragging QNT down to a cycle low of $58.7 by April 7. From there, the price action gradually curved upward in a rounded bottom, reclaiming lost ground and eventually gaining 100% from the low.
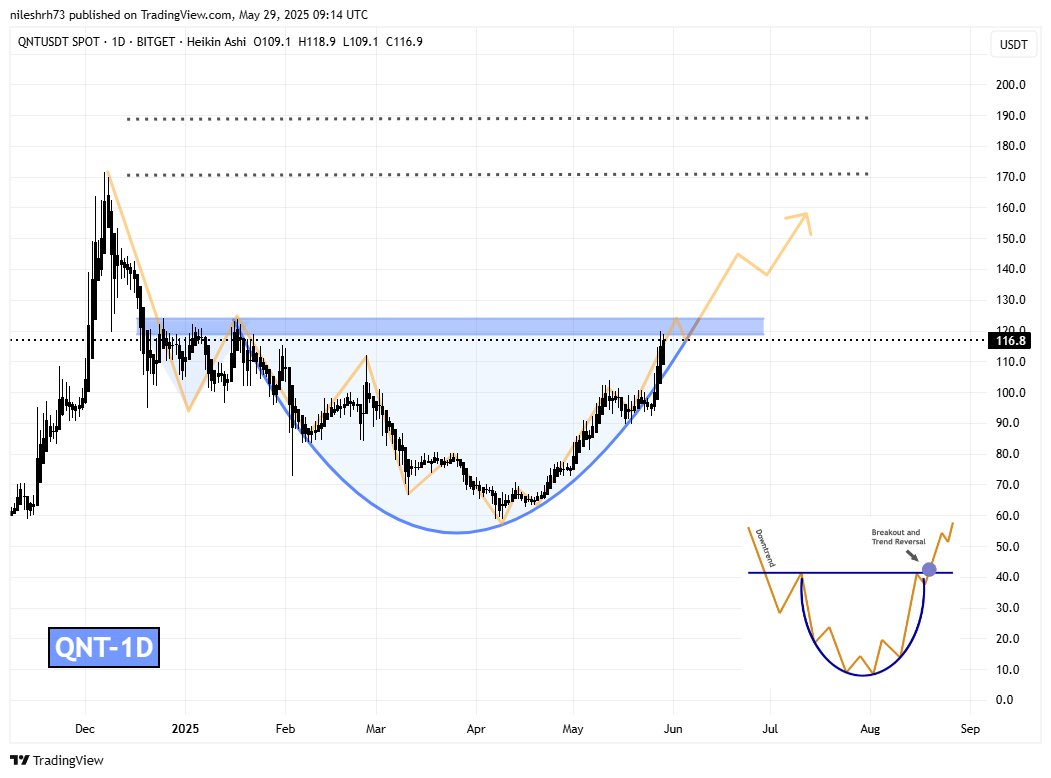 Quant (QNT) Daily Chart/Coinsprobe (Source: Tradingview)
QNT is now trading around $117, inching closer to the neckline resistance at $123. A successful breakout above this level would confirm the rounded bottom and potentially ignite a powerful upward move.
Based on the height of the pattern — from the bottom at $58 to the neckline at $123 — the projected breakout target sits near $188. This target also coincides with a key historical resistance zone, suggesting the market could see a further 61% upside from current prices if momentum holds.
What’s Next for QNT?
Disclaimer: This article is for informational purposes only and not financial advice. Always conduct your own research before investing in cryptocurrencies.