
Pi Network Sell-Off Continues as PI Hits 7-Day Low

Pi Network’s PI token has plunged 22% in a week, pressured by broad crypto selloffs and weakening institutional interest, risking a deeper downturn below key support.
Pi Network’s native token, PI, has witnessed a 22% price plunge over the past week, extending its downtrend to trade at a seven-day low of $ 0.61 at press time.
The double-digit decline reflects growing bearish sentiment around the token and coincides with a broader contraction in the crypto market.
PI’s Outlook Worsens as Bearish Trend Deepens
The global cryptocurrency market capitalization has dropped by over 5% in the past seven days, shedding over $170 billion. The widespread pullback has shaken investor confidence, triggering fresh PI selloffs over the past few days.
The strengthening sell-side pressure is evident in PI’s BBTrend indicator, which has continued to print red histogram bars, a clear signal of mounting bearish momentum. As of this writing, the indicator sits at -4.52.
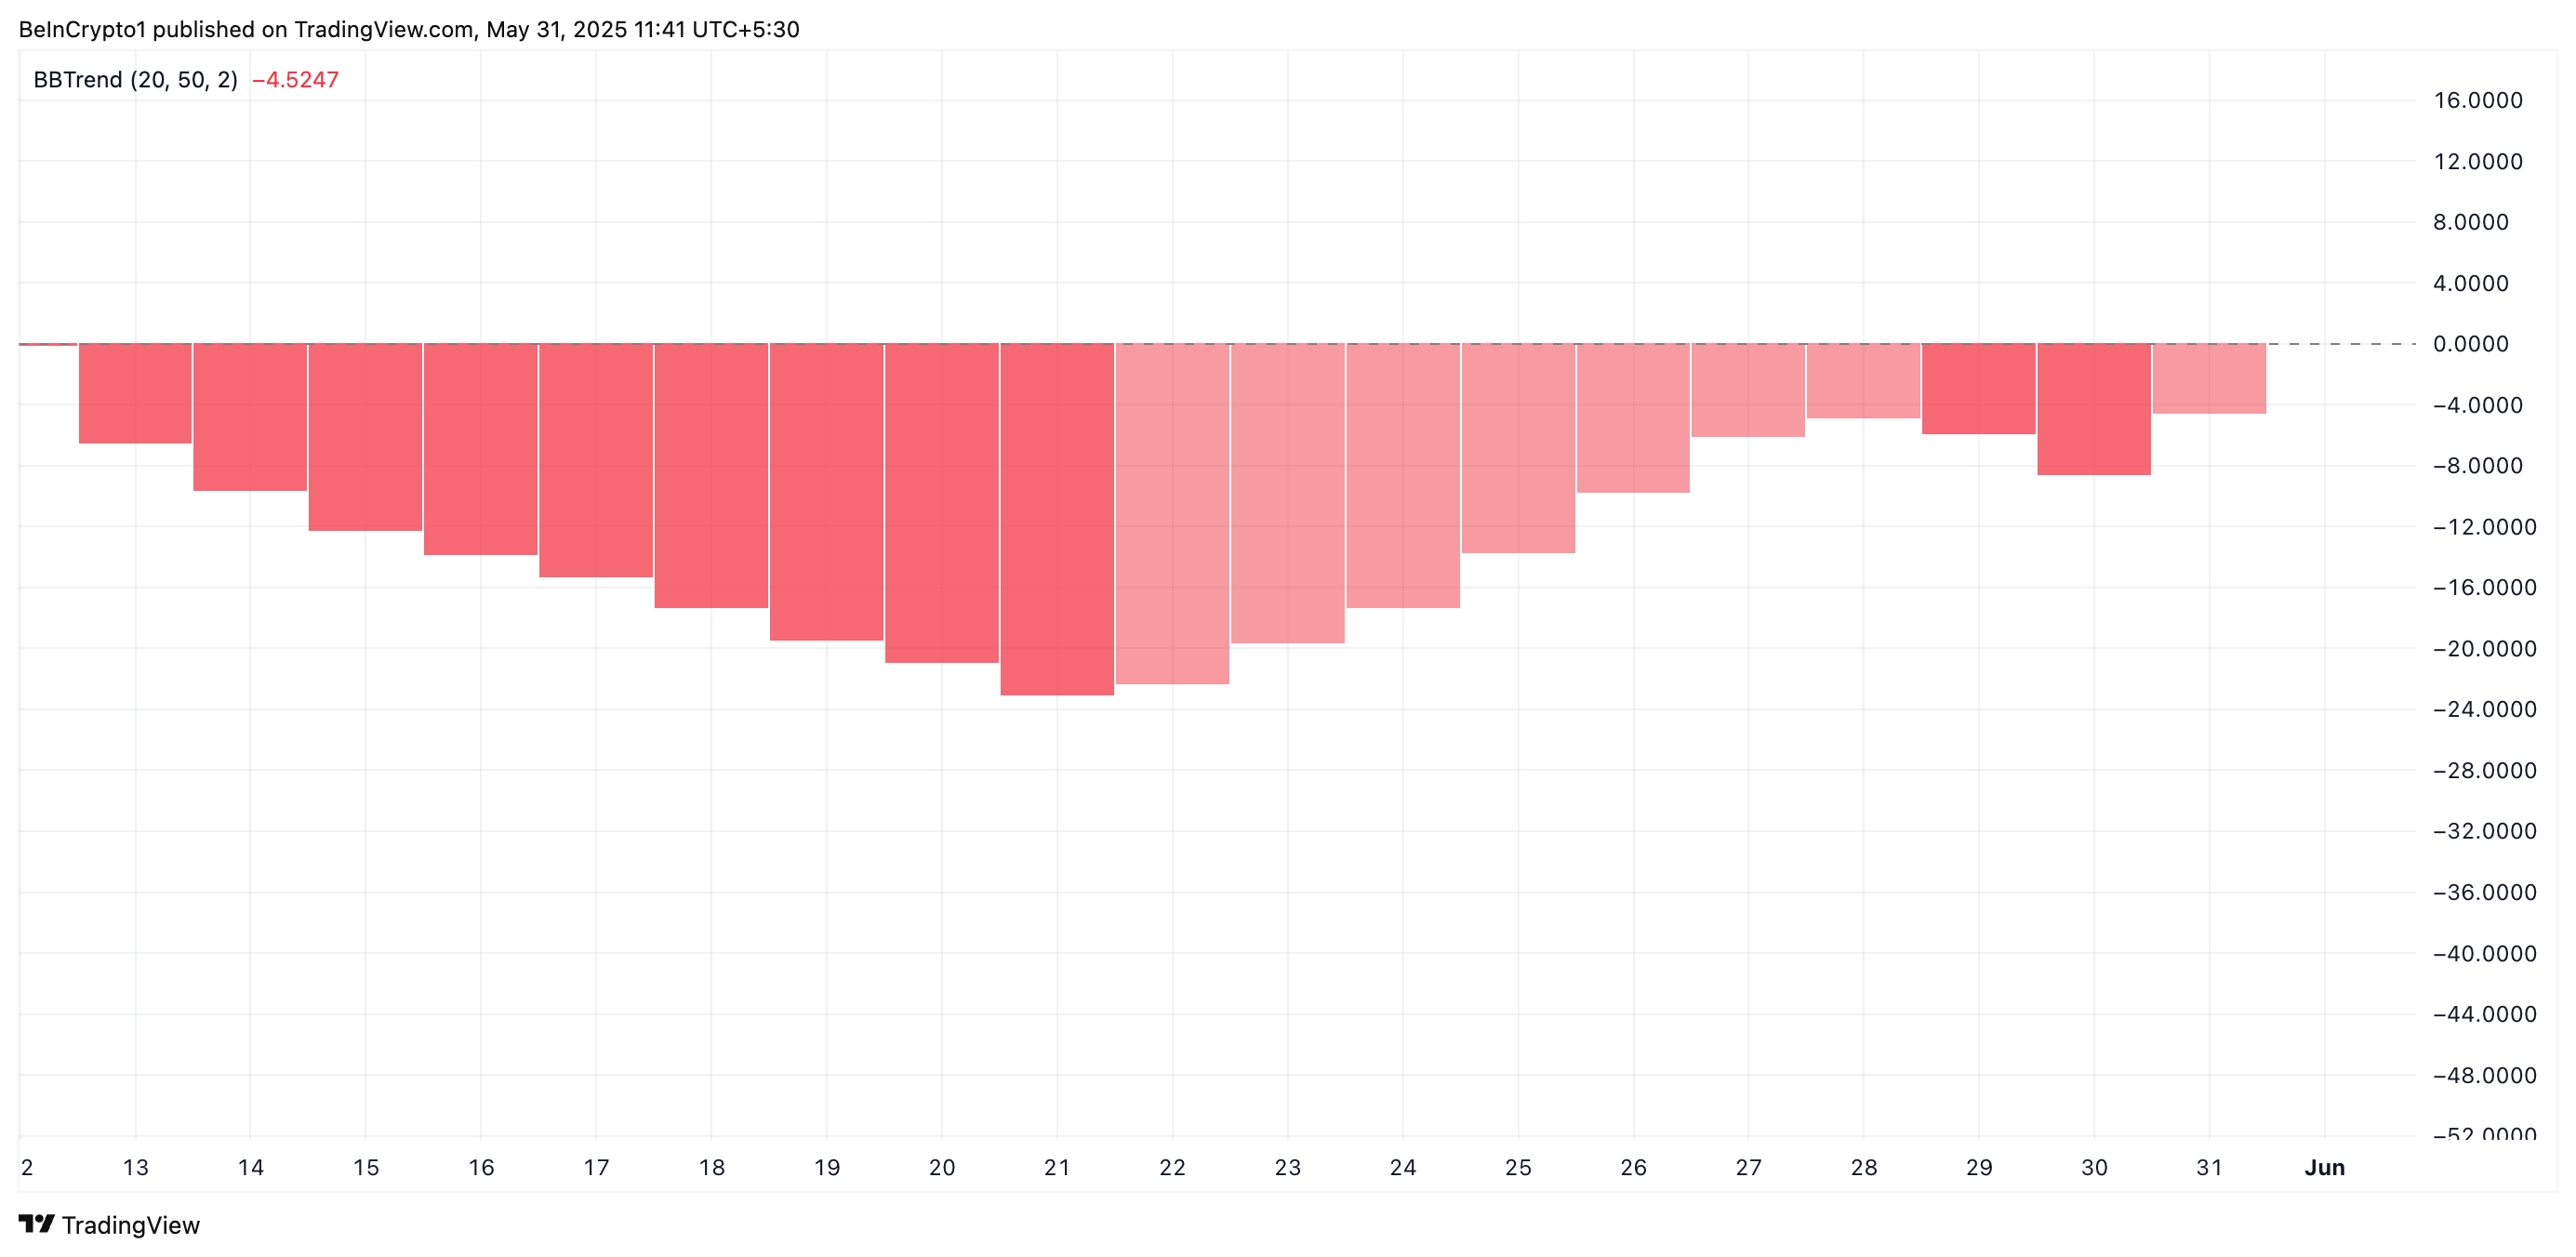 PI BB Trend. Source:
TradingView
PI BB Trend. Source:
TradingView
The BBTrend measures the strength and direction of a trend based on the expansion and contraction of Bollinger Bands. When BBTrend values are positive, it typically signals a strong uptrend, while negative values indicate increasing bearish momentum.
PI’s persistent negative BBTrend suggests that its price consistently closes near the lower Bollinger Band. This trend indicates sustained selling activity and hints at the potential for a sustained price decline.
Further, PI’s Smart Money Index (SMI) has fallen over the past few days, signaling an exit of “smart money” or institutional-grade investors. This is often considered a leading indicator of deeper price declines, as it suggests reduced confidence from these key investors.
 PI SMI. Source:
TradingView
PI SMI. Source:
TradingView
An asset’s SMI tracks the activity of institutional investors by analyzing market behavior during the first and last hours of trading. When it rises, these investors are increasing their buying activity, indicating the likelihood of an extended rally.
Conversely, as with PI, when it falls, it indicates that institutional demand for the asset is weakening, signalling potential for further downside.
PI Teeters Near Key Support—Will Bulls Hold the Line at $0.55?
PI’s climbing selling activity suggests that the token could be vulnerable to further losses in the short term. If selloffs continue, the altcoin risks breaking below the critical support formed at $0.55.
If the bulls fail to defend this support floor, PI could revisit its all-time low of $0.40.
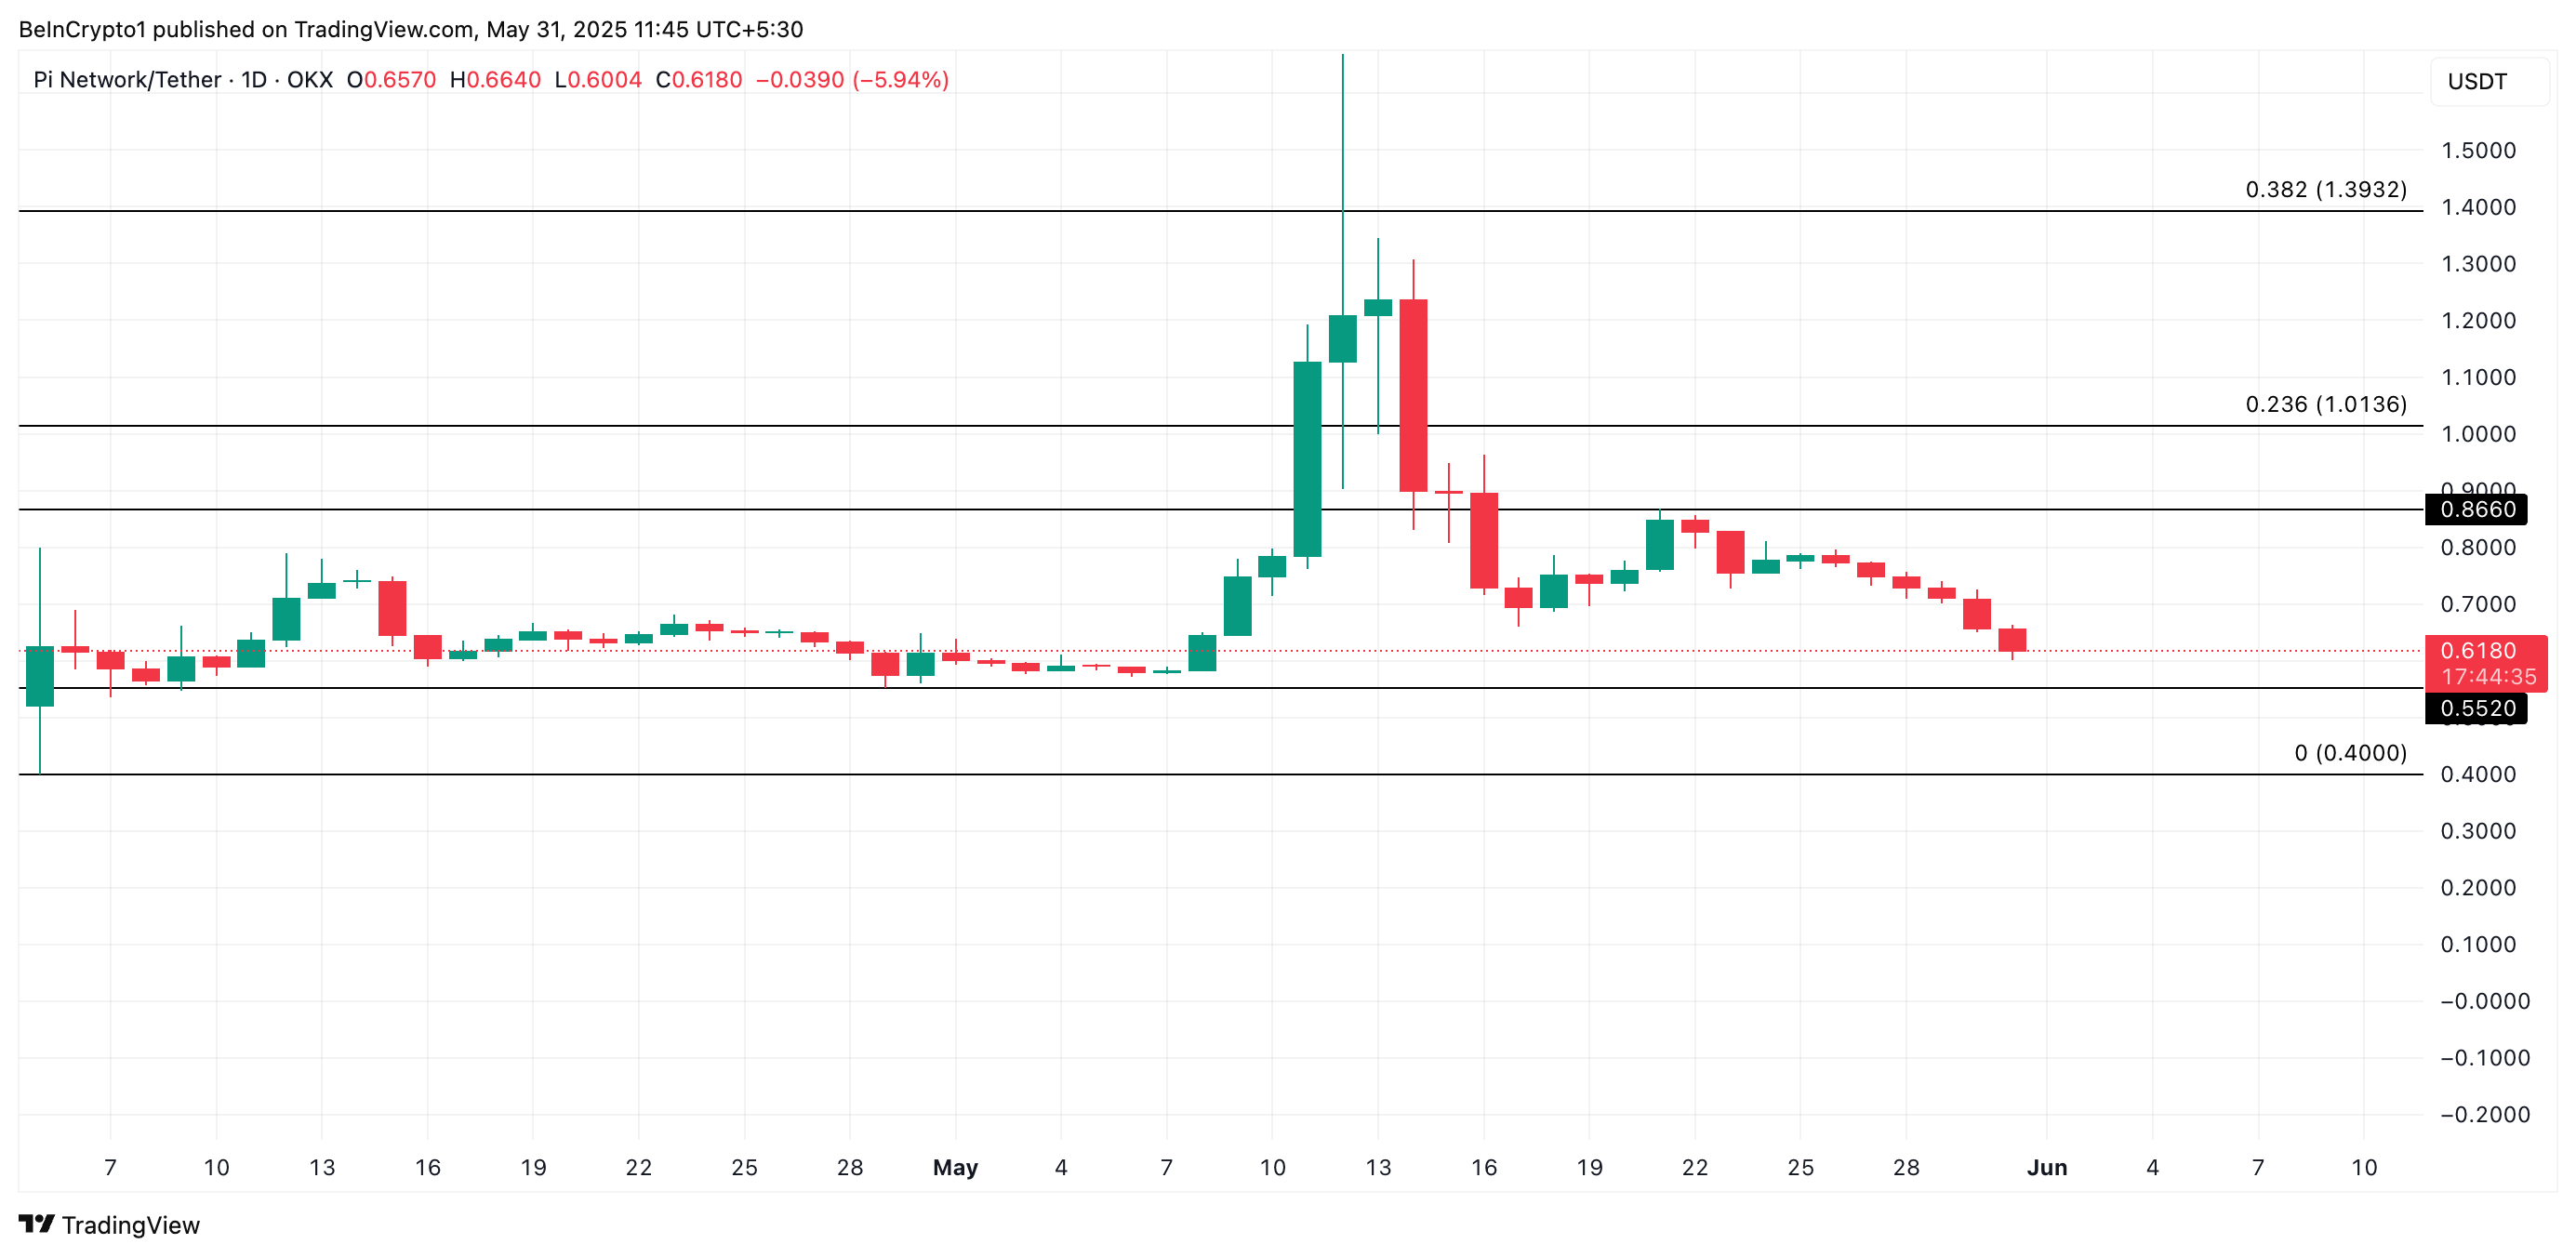 PI Price Analysis. Source:
TradingView
PI Price Analysis. Source:
TradingView
However, a spike in new demand for the token could prevent this from happening. If the PI Network token buying pressure spikes, it could push its price to $0.86.
Disclaimer: The content of this article solely reflects the author's opinion and does not represent the platform in any capacity. This article is not intended to serve as a reference for making investment decisions.
You may also like
A decade-long tug-of-war ends: "Crypto Market Structure Bill" sprints to the Senate
At the Blockchain Association Policy Summit, U.S. Senators Gillibrand and Lummis stated that the "Crypto Market Structure Bill" is expected to have its draft released by the end of this week, with revisions and hearings scheduled for next week. The bill aims to establish clear boundaries for digital assets by adopting a classification-based regulatory framework, clearly distinguishing between digital commodities and digital securities, and providing a pathway for exemptions for mature blockchains to ensure that regulation does not stifle technological progress. The bill also requires digital commodity trading platforms to register with the CFTC and establishes a joint advisory committee to prevent regulatory gaps or overlapping oversight. Summary generated by Mars AI. The accuracy and completeness of this summary, generated by the Mars AI model, is still being iteratively updated.

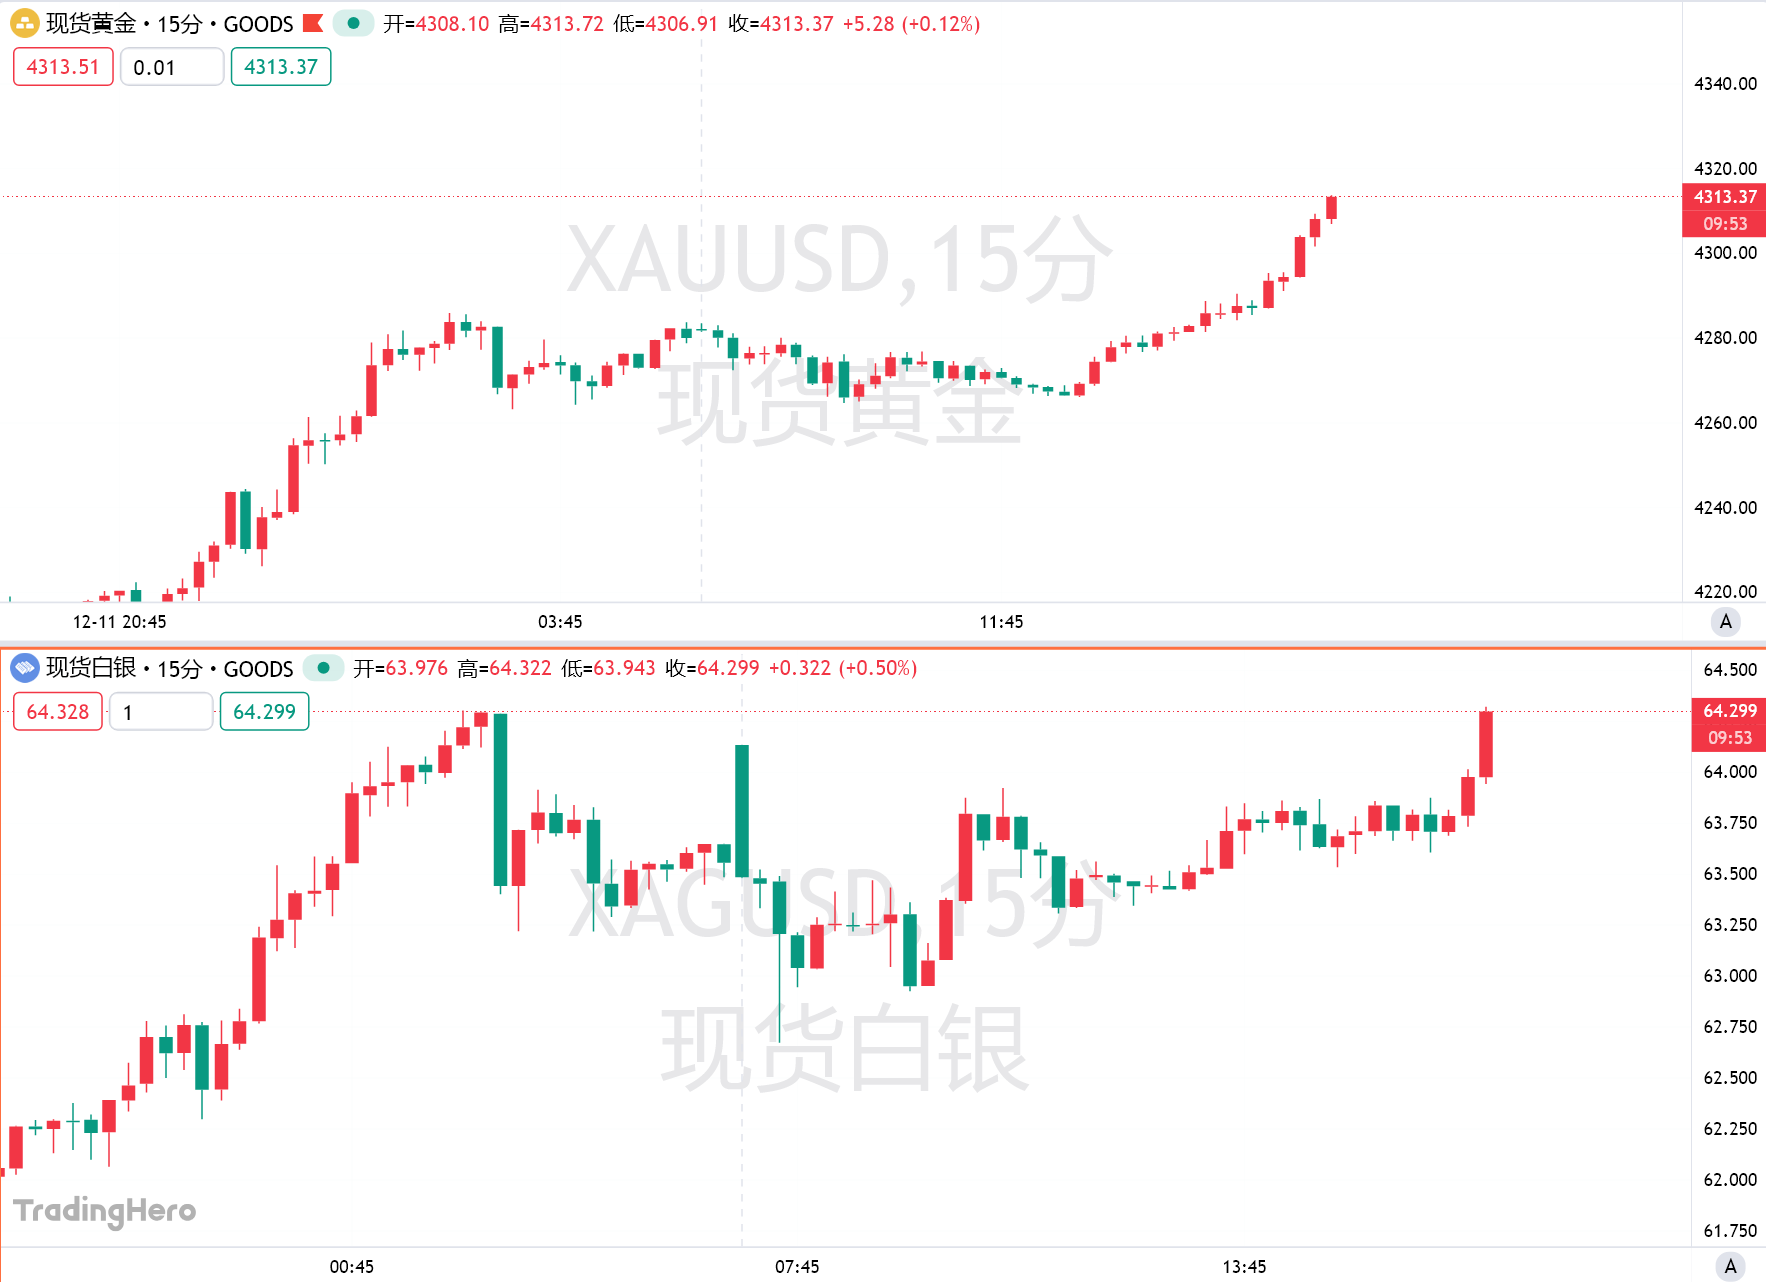
Gold surpasses the $4,310 mark—Is the "bull frenzy" returning?
Boosted by expectations of further easing from the Federal Reserve, gold has risen for four consecutive days. Technical indicators show strong bullish signals, but there remains one more hurdle before reaching a new all-time high.
Trend Research: Why Are We Still Bullish on ETH?
Against the backdrop of relatively accommodative expectations in both China and the US, which suppress asset downside volatility, and with extreme fear and capital sentiment not yet fully recovered, ETH remains in a favorable "buy zone."
