

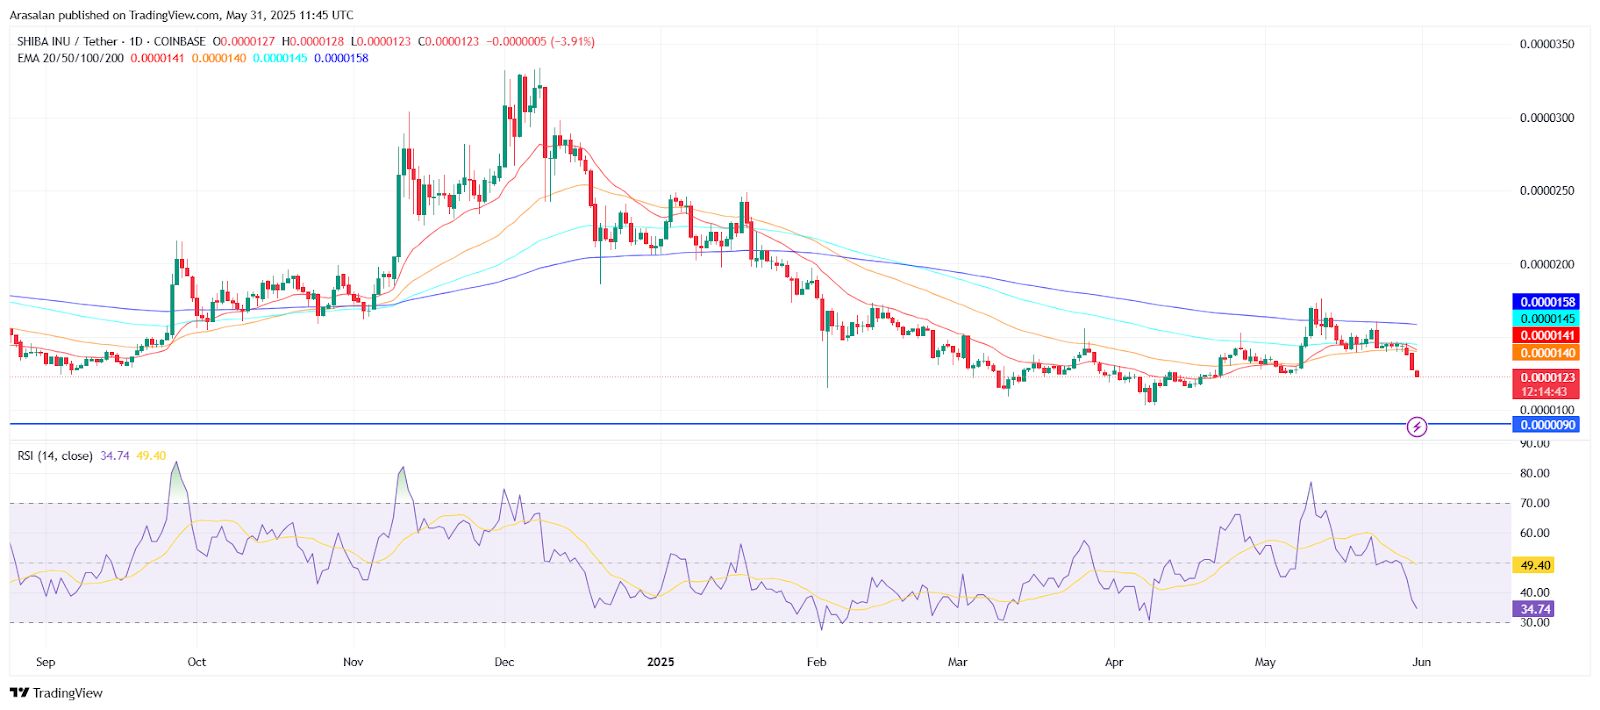
- SHIB breaks below crucial support, raising concerns of further declines toward $0.000009.
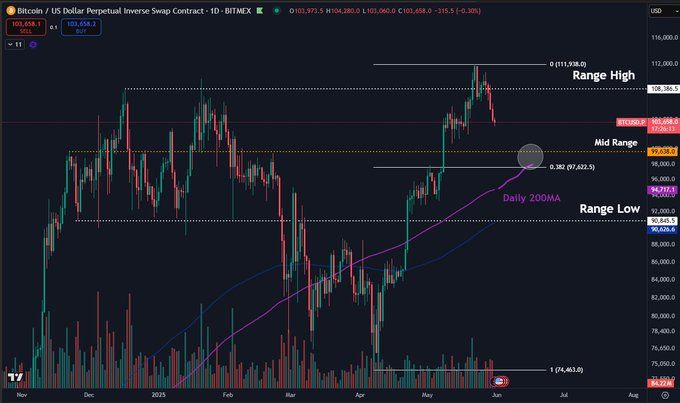
- Bitcoin falls below $104K support; the next test lies at $ 97K – $99 K for potential reversal.
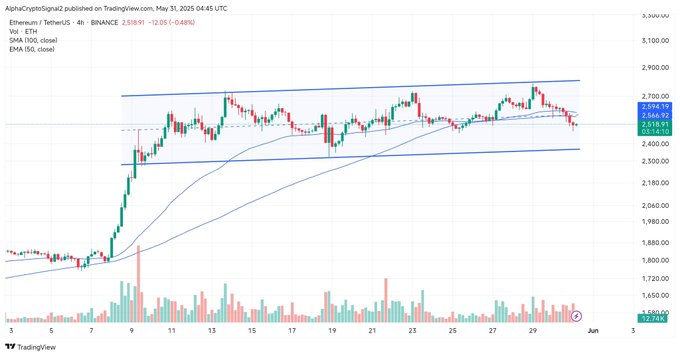
- Ethereum struggles below key EMAs, with support at $2,400-$2,450 and risk of further decline.
Shiba Inu (SHIB), Bitcoin (BTC), and Ethereum (ETH) are approaching significant points in their price trends. SHIB has dropped in price after falling below critical supports, and Bitcoin has shown signs that it may reverse following its recent highs. Ethereum is moving within an upward-sloping channel, struggling to choose a clear path.
As of press time, Shiba Inu is trading at $0.00001237 , down by a 7.80% drop over the past day. The meme coin recently dropped below its 50-day EMA support, which had been holding its price for the previous few months. As a result of this breach, there is a concern about lower prices, which could drop below the support range of $0.0000120-$0.000009. In this case, SHIB would increase by another zero, and this could make investors anxious and more likely to sell their SHIB.
 Source: TradingView
More selling is putting pressure on SHIB , since its RSI is on a downward trend. If this range cannot be overcome, the coin might drop down to $0.000009. Such a market fall would be stressful for traders, mainly because much of Shiba Inu’s value is based on speculation.
Bitcoin Faces Critical Support Levels and Possible Trend Shift
Meanwhile, Bitcoin looks to be changing direction. The cryptocurrency has failed to hold above $104,000 and is trading at $103,537 as of press time. Analyst Daan Crypto Trades believes that Bitcoin’s recent fall merely puts it back within a bigger trading range.
According to the analyst, an important support area is located near $ 97,000 and $ 99,000, which is confirmed by the Fibonacci retracement and the Daily 200 MA. Staying within this range could determine whether Bitcoin gears up for another all-time high retest or risks further downside.
 Source: X
For Bitcoin to change course, it requires a move over its previous peak. Due to the recent highs being turned down, many people in the market are being more cautious. The way Bitcoin moves over the next weeks could indicate the start of a clear trend.
Ethereum Struggles Below Key EMAs with Support Near $2,400
The Ethereum price on the 4-hour chart is moving upwards in an obvious ascending channel, creating higher highs and higher lows. Yet, ETH just dropped below the 50 EMA and 100 SMA, which suggests weakness over the short term. The midline of the channel is slightly above its price, and its most recent support levels are near $2,400–$2,450.
 Source: X
If price bounces from support, it could keep the channel in place and give investors a good long-term chance to profit by targeting the upper trendline at $2,700–$2,800. If ETH closes beneath the channel support, the pattern might break, and the price could decline to $2,300 or $2,100. People trading should monitor volume closely as the market recovers and enter only when a convincing reversal signal appears.
Related: Altcoins on Divergent Paths: XRP Nears Breakout Level, Solana Holds Key Support, Shiba Inu Flashes Bearish Warnings
Disclaimer: The information presented in this article is for informational and educational purposes only. The article does not constitute financial advice or advice of any kind. Coin Edition is not responsible for any losses incurred as a result of the utilization of content, products, or services mentioned. Readers are advised to exercise caution before taking any action related to the company.