

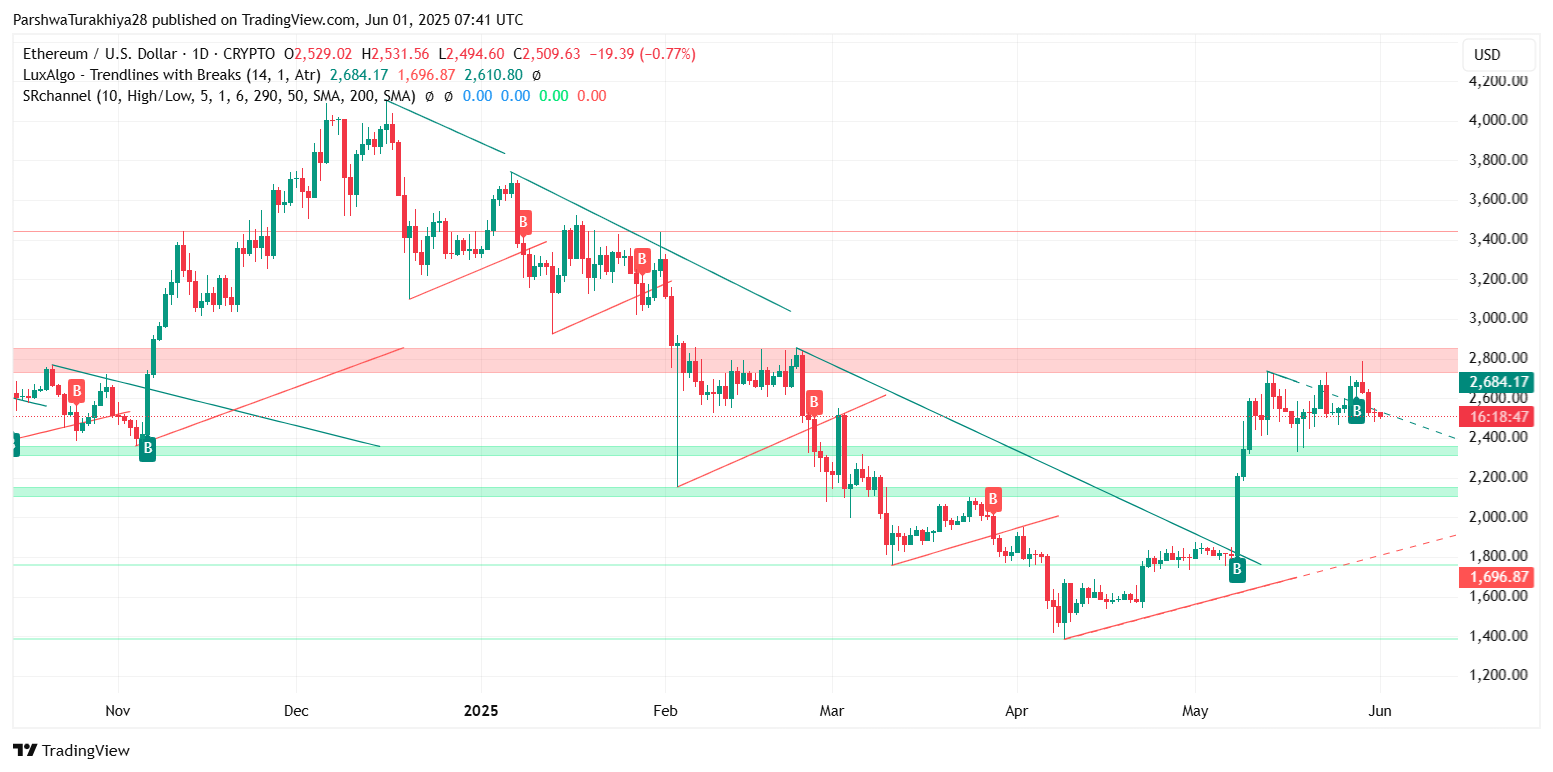
After failing to hold the $2,600 handle earlier this week, Ethereum price today has slipped toward $2,505, reflecting a sustained downtrend from May highs. The recent breakdown from a rising wedge structure and repeated rejections below key resistance zones suggest that bearish momentum continues to weigh on the short-term outlook. ETH is now testing a critical confluence support near $2,500, with a deeper slide on the cards if bulls fail to defend this floor.
What’s Happening With Ethereum’s Price?
 ETH price dynamics (Source: TradingView)
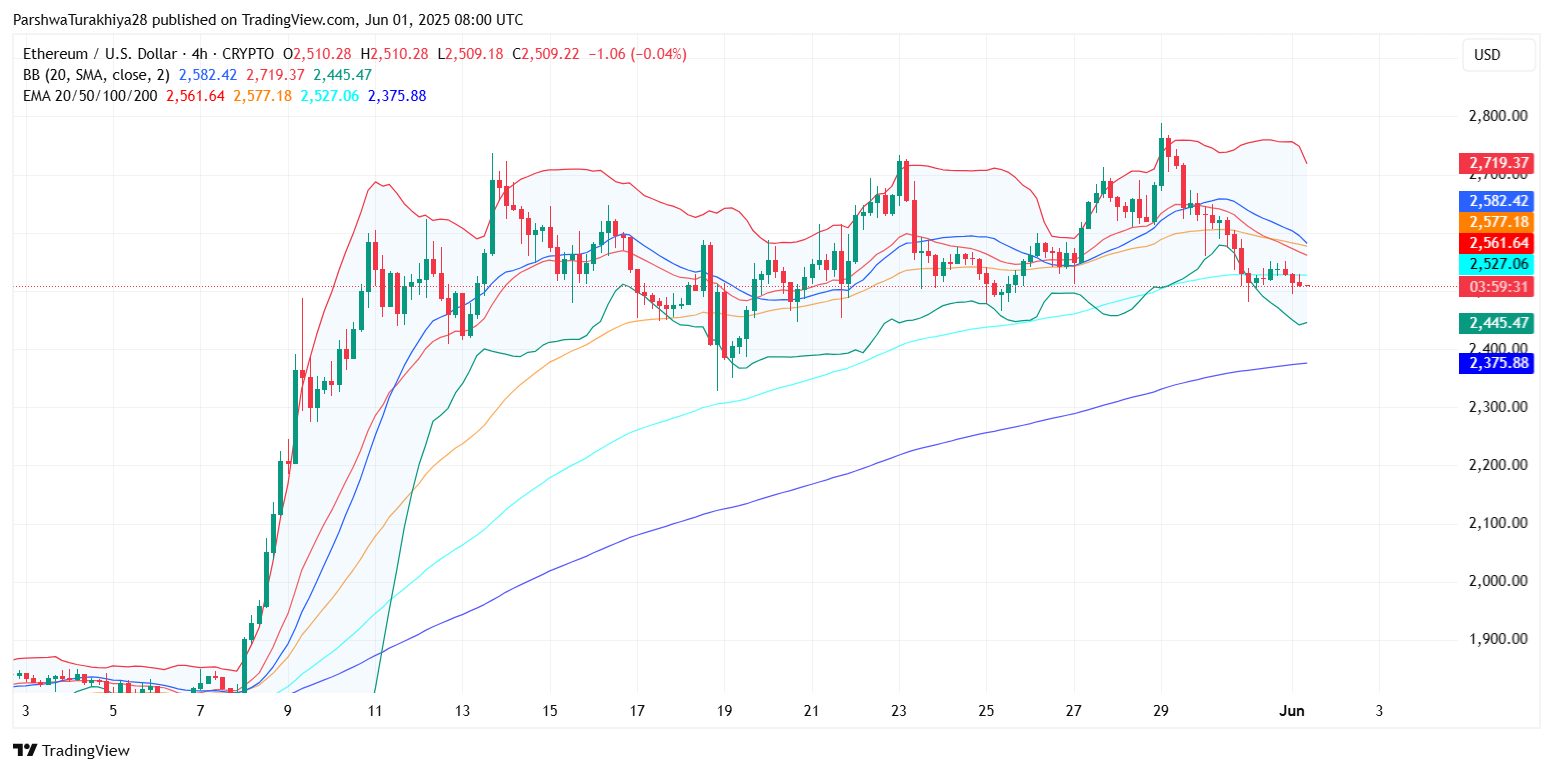
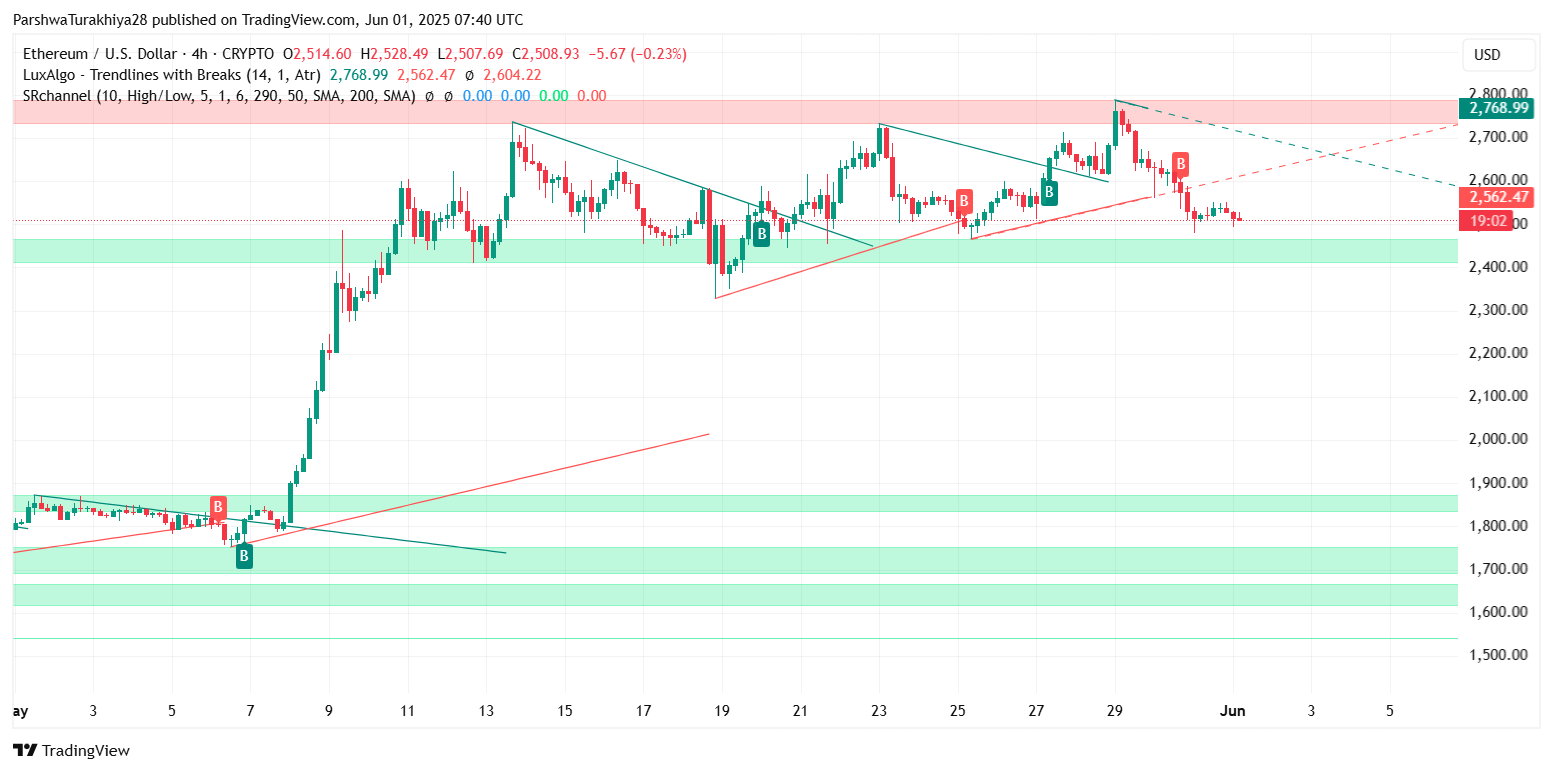
On the 4-hour chart, Ethereum price action shows a clear shift in sentiment after the local top above $2,768. Price is now consistently closing below the 20/50 EMA cluster between $2,527 and $2,577, while the Bollinger Bands have started widening after a period of consolidation — a technical signal that often precedes elevated Ethereum price volatility. ETH is also trading near the lower Bollinger Band ($2,445), adding further pressure to the $2,500 threshold.
 ETH price dynamics (Source: TradingView)
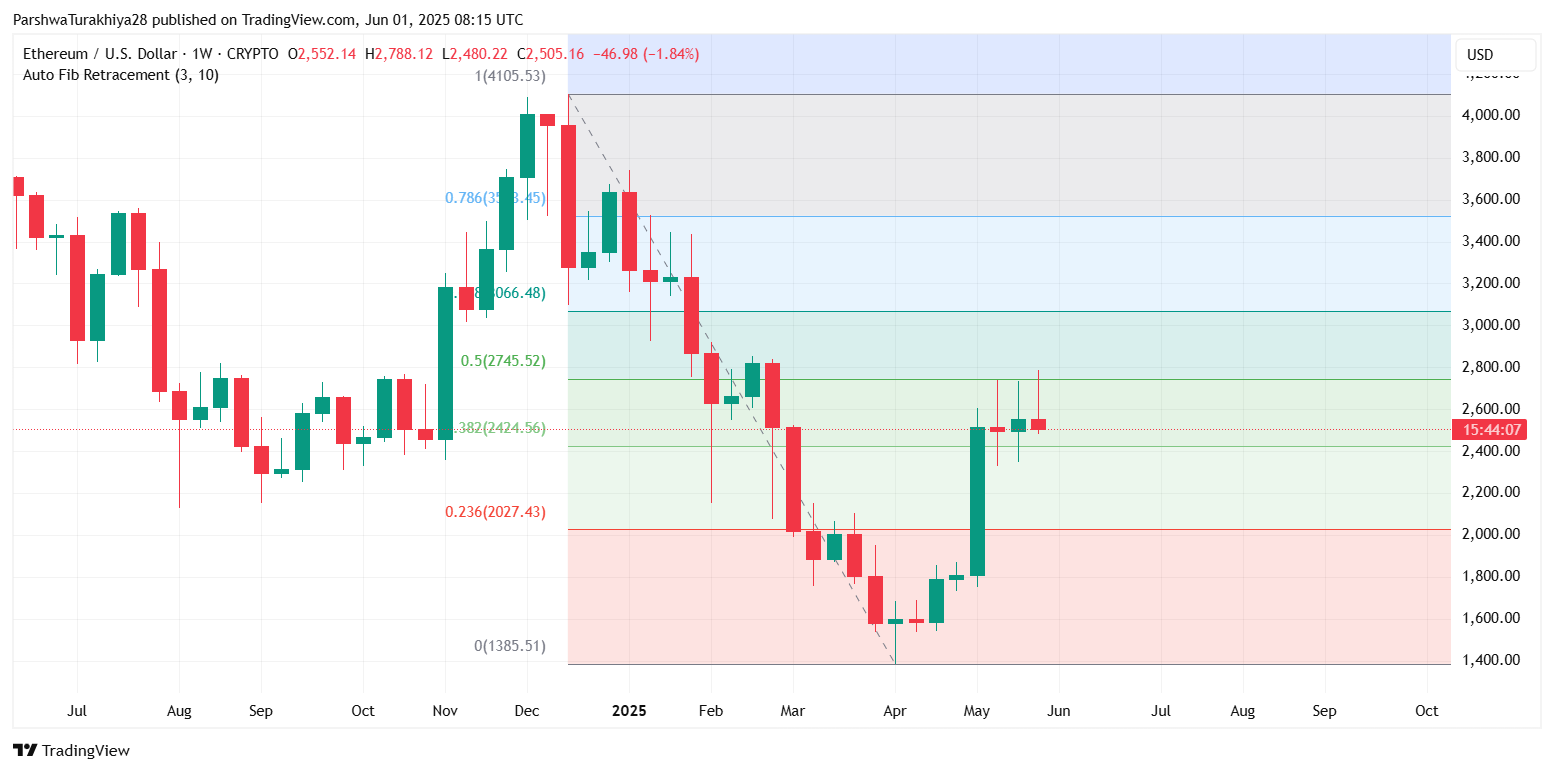
From a structure standpoint, the loss of the $2,532–$2,545 zone, which had previously acted as short-term support, opens the path for ETH to revisit the green demand block near $2,445–$2,475. On the daily chart, ETH has printed three successive lower highs, and price is now sitting just above the weekly 0.382 Fibonacci retracement level at $2,424 — a decisive zone for trend maintenance in June.
Momentum Indicators Hint at Bearish Continuation
 ETH price dynamics (Source: TradingView)
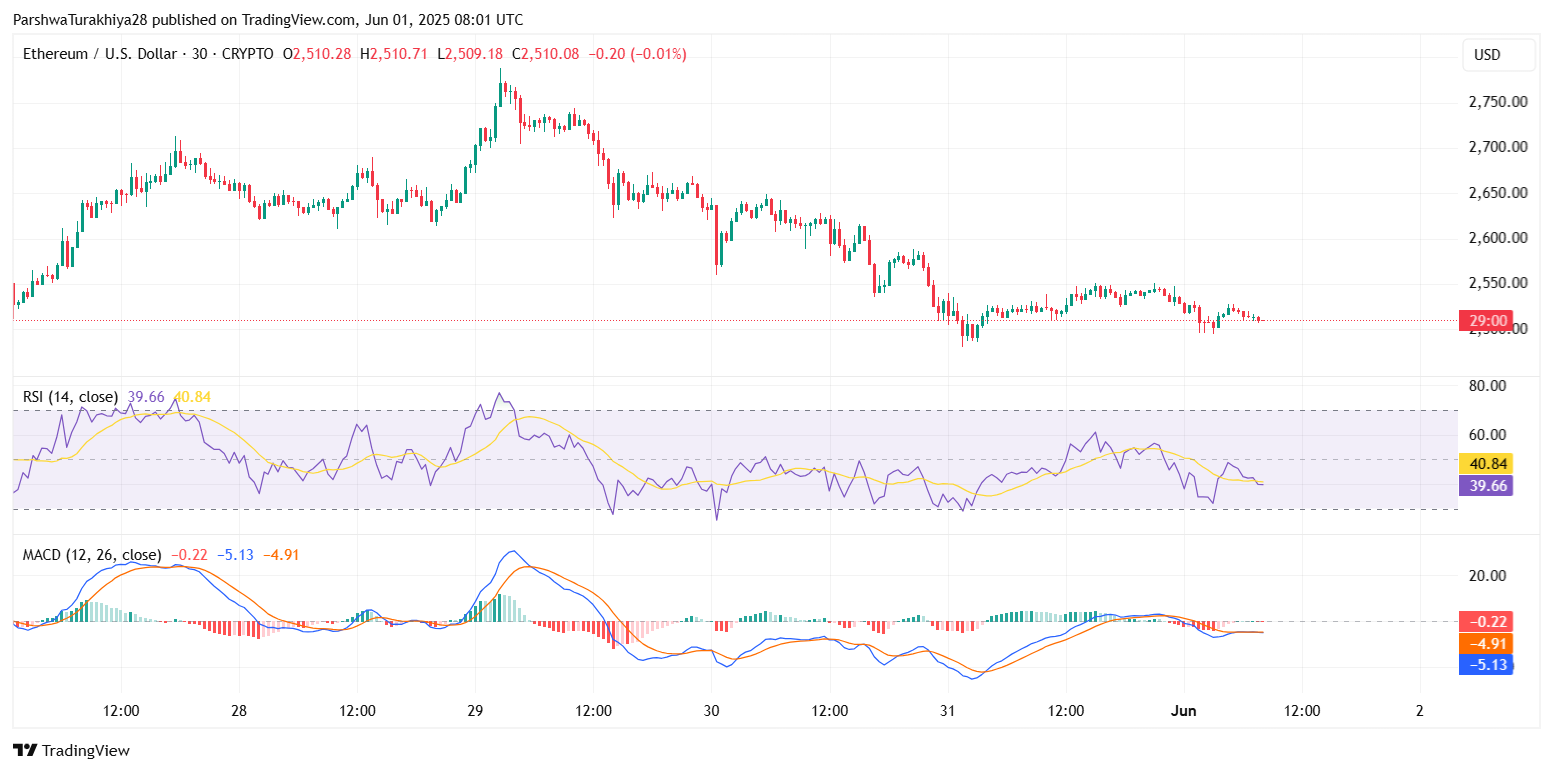
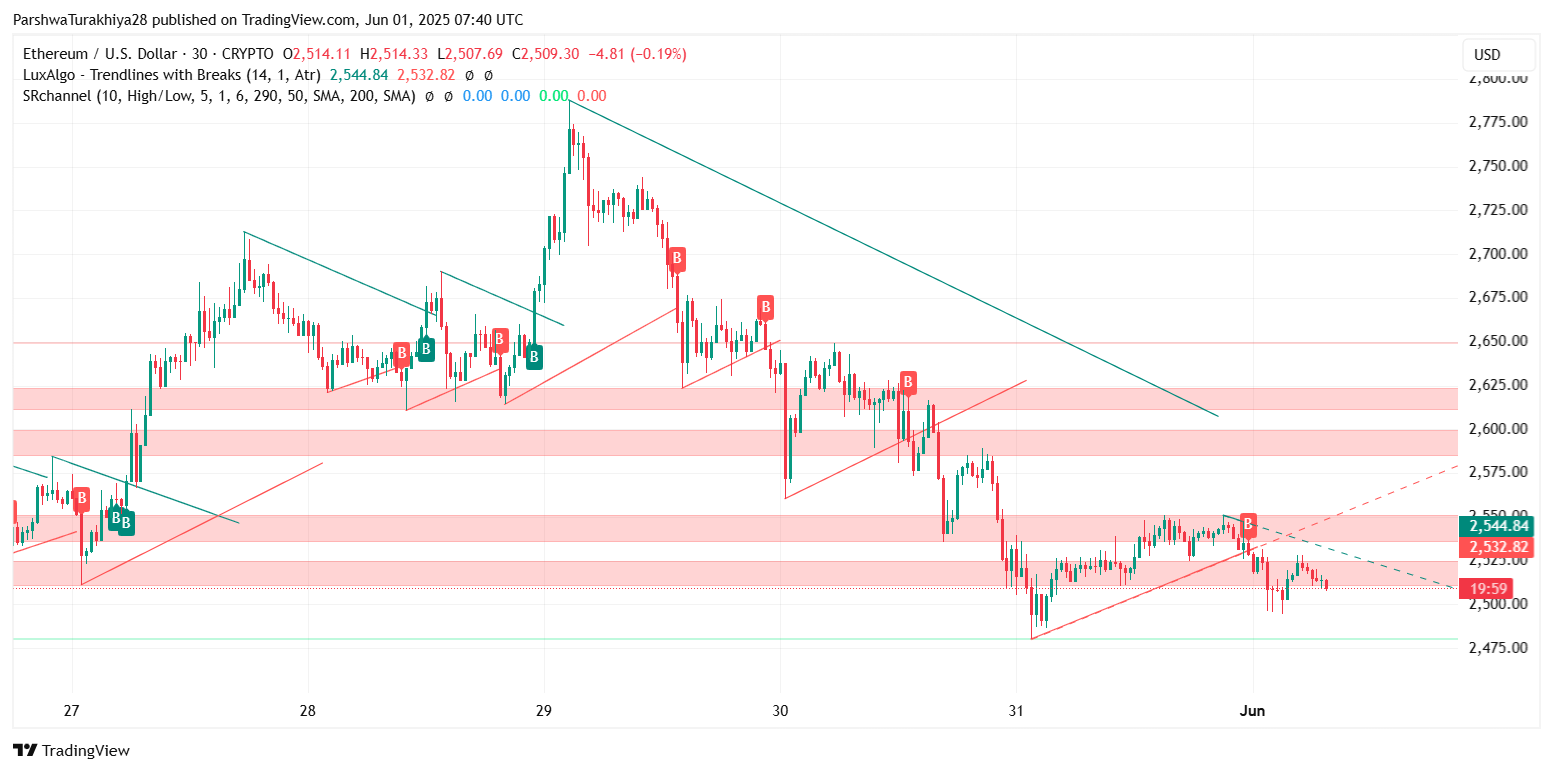
The 30-minute chart shows Ethereum price update consolidating in a narrow band between $2,500 and $2,530, but momentum signals remain weak. RSI is holding at 39.66, below the 50-neutral line, suggesting continued downside risk. MACD is also in bearish territory, with histogram bars flattening just beneath the zero line, implying persistent pressure but limited acceleration — a setup often seen before short breakdowns.
 ETH price dynamics (Source: TradingView)
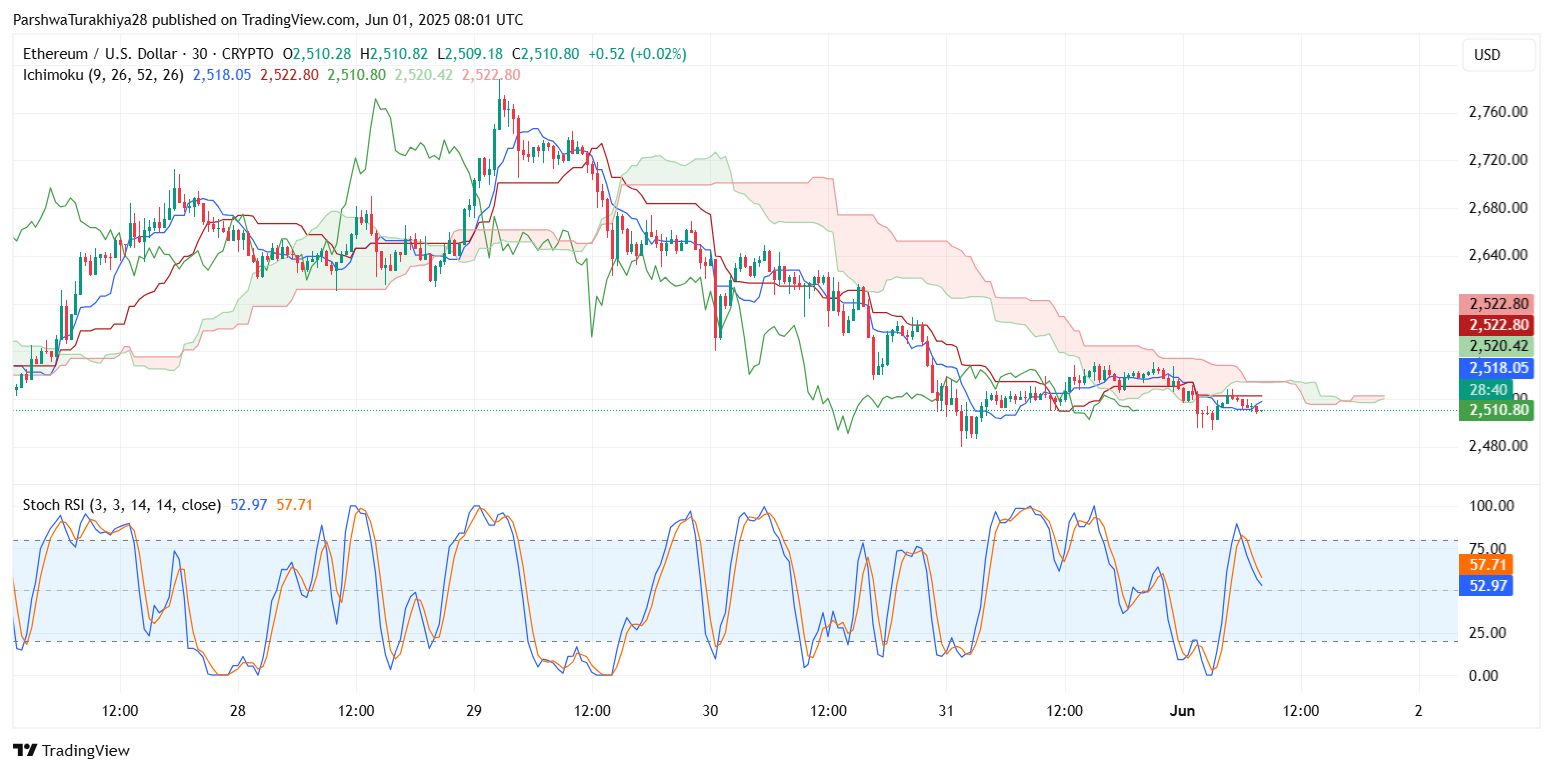
Meanwhile, the Ichimoku Cloud on the 30-minute chart reinforces this bearish setup. Price is stuck below the cloud with flat Tenkan-Sen and Kijun-Sen, and the Chikou Span is trailing well below price, confirming a bearish outlook. The Stoch RSI hovers near 53, but with no strong crossover forming, it offers little evidence of an imminent bounce. Traders watching Ethereum price action will need to see a move back above $2,545 for any renewed bullish confidence.
Why is the Ethereum Price Going Down Today?
 ETH price dynamics (Source: TradingView)
The core reason why Ethereum price went down today is the rejection at $2,768 resistance and the failure to sustain momentum after the late-May breakout. This area is aligned with a significant liquidity zone and a long-term descending trendline from the November 2023 highs, where sellers have historically re-entered.
 ETH price dynamics (Source: TradingView)
On the 4-hour and daily trend charts, ETH broke below a rising wedge, invalidating a bullish continuation setup. The Chande Momentum Oscillator shows a reading of -33.60, indicating strong bearish pressure in the short term. Unless this begins to recover alongside price reclaiming intraday highs, the downside risks remain firmly in play. The break below $2,532 now exposes Ethereum to the next demand block closer to $2,445–$2,475.
Ethereum Price Outlook for 2nd June
 ETH price dynamics (Source: TradingView)
The short-term bias for ETH remains bearish unless bulls can flip the $2,545–$2,562 resistance zone back into support. A successful breakout above $2,577 would bring $2,600 and then $2,645 back into focus. However, without volume expansion or a clear shift in momentum indicators, upside remains limited.
On the downside, failure to hold above $2,500 could lead to a quick dip toward the $2,445–$2,475 region, followed by potential tests of the 200 EMA on the 4-hour chart near $2,375. With RSI oversold but not recovering and MACD bearish, the probability of a breakdown remains high unless bulls step in swiftly above $2,545.
ETH Technical Forecast Table: 2nd June
| Indicator / Zone | Level (USD) | Signal |
| Resistance 1 | 2,545 | Minor breakout zone |
| Resistance 2 | 2,577 | EMA cluster rejection |
| Support 1 | 2,500 | Immediate holding level |
| Support 2 | 2,445 | Demand zone + Bollinger Band |
| EMA 20/50 (4H) | 2,561 / 2,577 | Bearish crossover in progress |
| RSI (30-min) | 39.66 | Bearish territory |
| MACD (30-min) | -0.22 | Bearish, flat histogram |
| Ichimoku (30-min) | Below Cloud | Trend bias negative |
| Chande Momentum Osc. | -33.60 | Bearish momentum |
Disclaimer: The information presented in this article is for informational and educational purposes only. The article does not constitute financial advice or advice of any kind. Coin Edition is not responsible for any losses incurred as a result of the utilization of content, products, or services mentioned. Readers are advised to exercise caution before taking any action related to the company.