After a swift vertical rally over the weekend, Mask Network price today is showing signs of cooling as traders assess whether the recent breakout has legs. As of writing, Mask Network price is hovering near $2.56, down marginally by 0.1% in the last 24 hours. The correction follows a sharp rejection near the $2.80 resistance zone, which coincides with key Fibonacci levels on the higher timeframe chart.
The price action on June 2 reflects a consolidation phase after a steep move higher. A decisive breakout above $2.50 on June 1 propelled MASK into an overbought zone, with bullish momentum now facing resistance from both structural ceilings and weakening indicators.
What’s Happening With Mask Network’s Price?
 MASK price prediction (Source: TradingView)
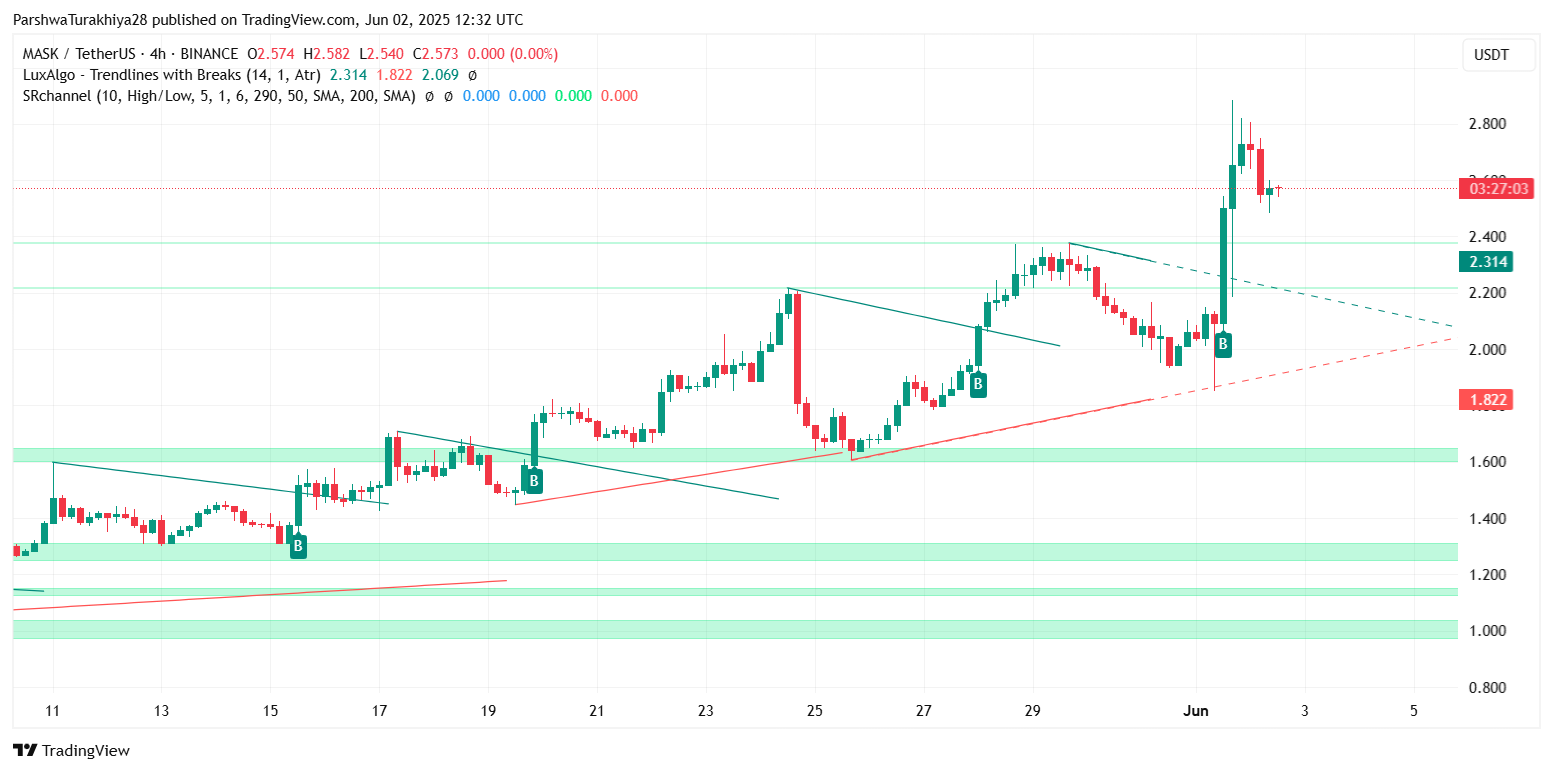
The recent surge in Mask Network price action originated from a breakout above the falling wedge formation seen on the 4-hour chart. This breakout was supported by strong bullish volume and a clear move above the $2.30–$2.40 demand zone, which had previously capped upside for weeks.
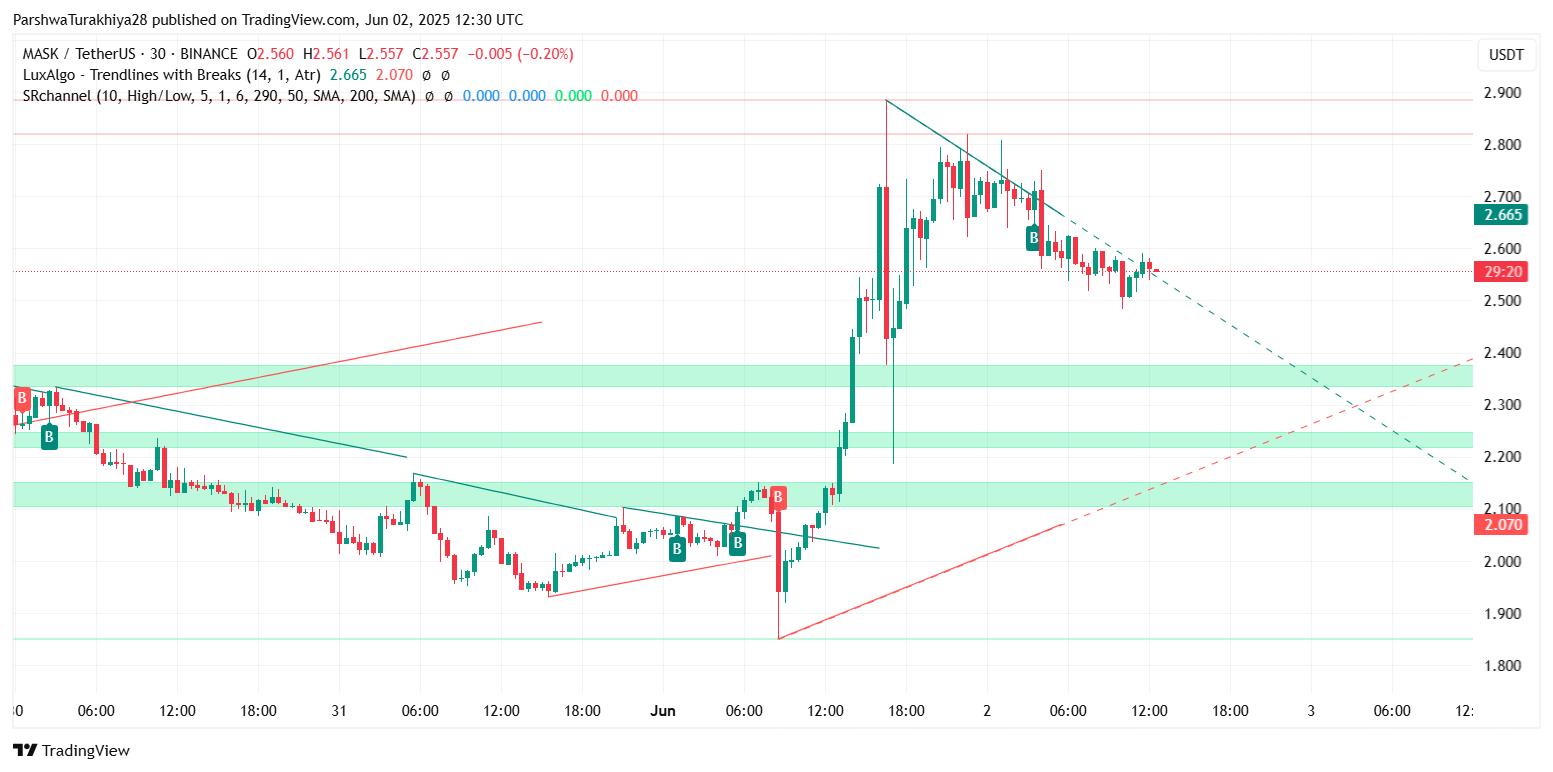
However, price has since formed a descending trendline on the 30-minute chart, suggesting early-stage distribution. Attempts to reclaim the $2.65–$2.75 area have failed twice, indicating resistance strength. The current trading range lies between $2.46 support and $2.65 resistance, forming a narrow short-term coil.
This hesitation suggests a pause before the next directional move. The chart now resembles a tightening triangle pattern, often a precursor to volatility expansion.
Indicators Signal a Mixed Outlook
 MASK price prediction (Source: TradingView)
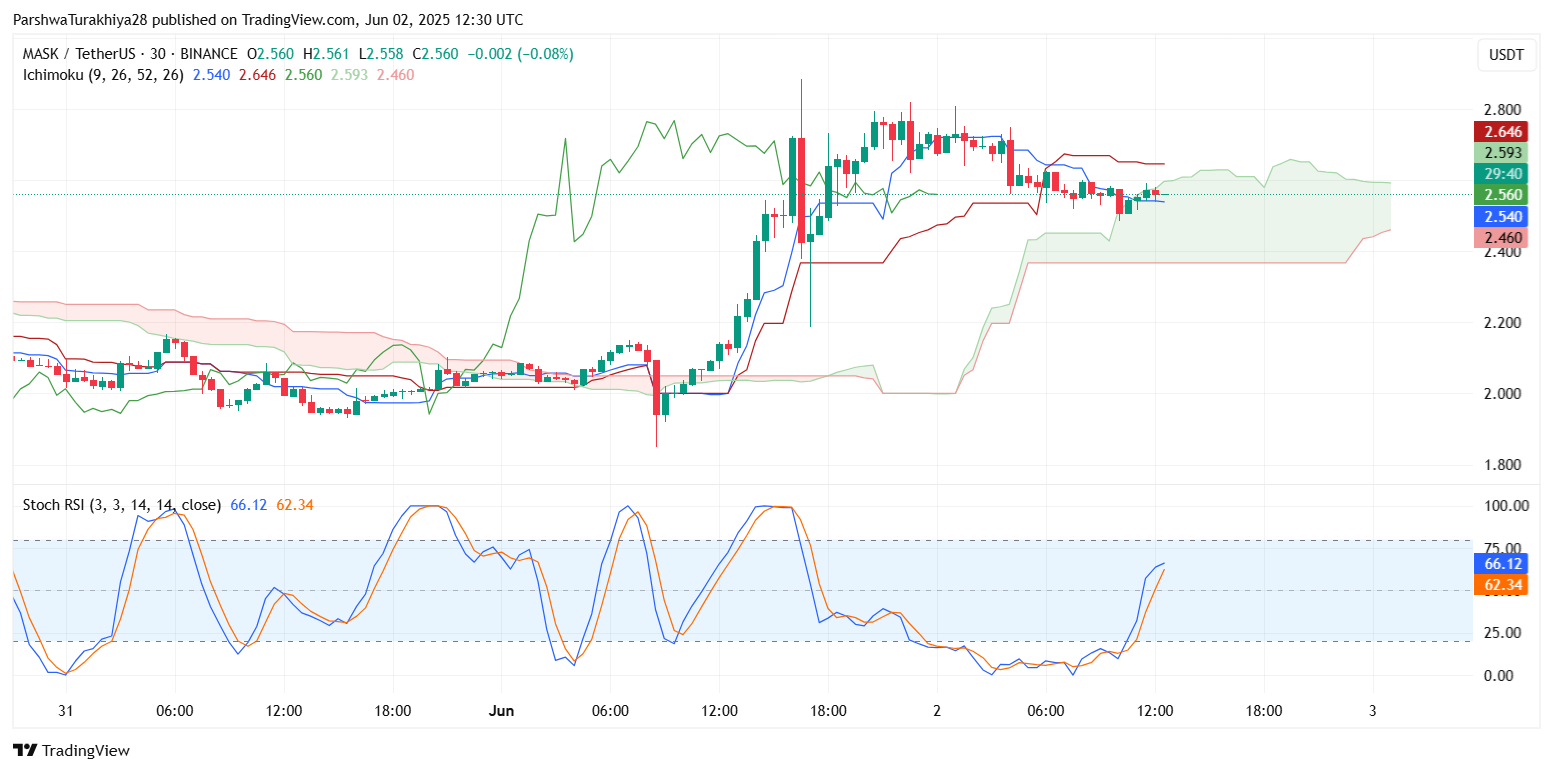
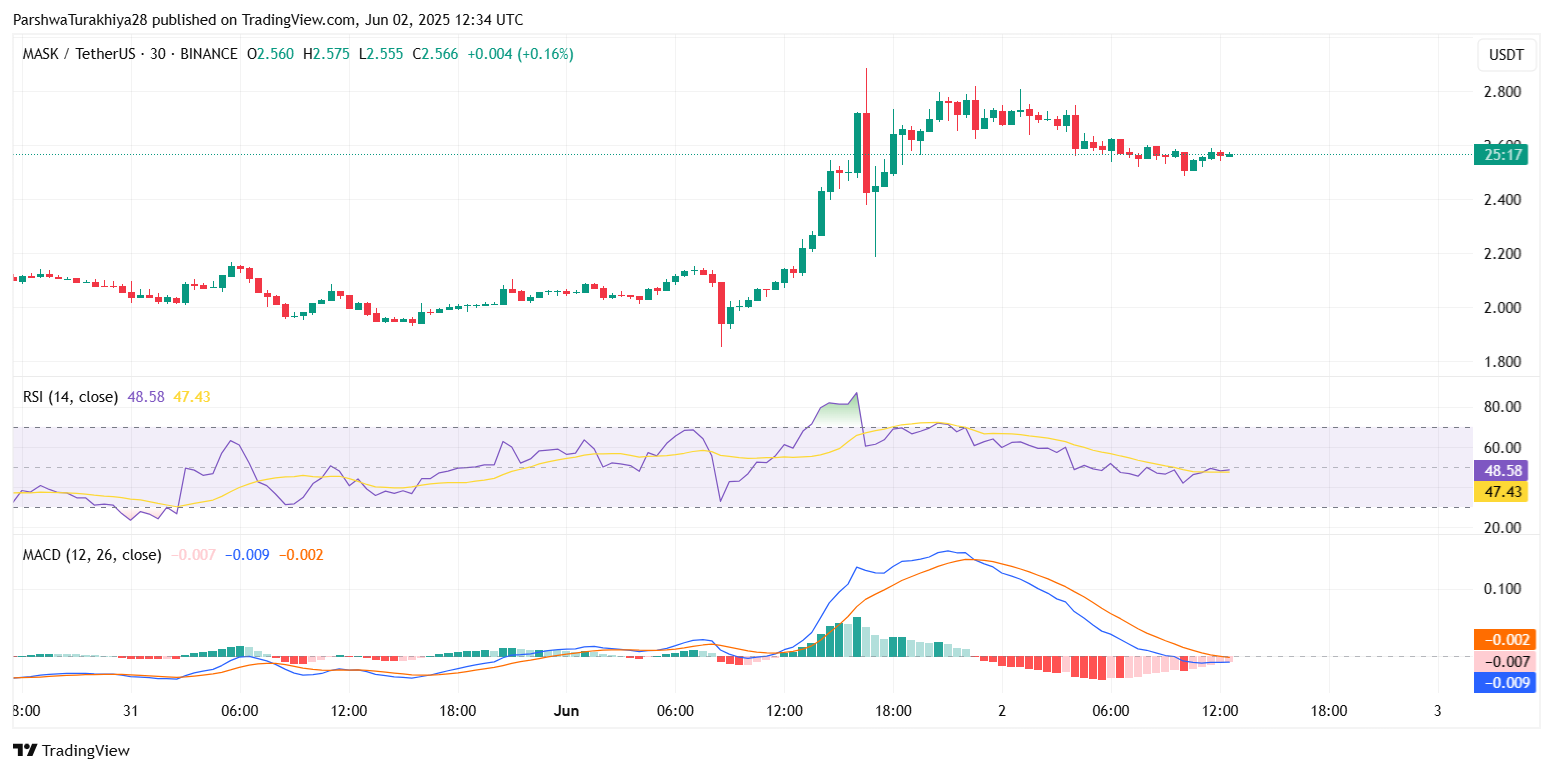
Stochastic RSI on the 30-minute chart is currently hovering near 66.12, showing signs of cooling after tapping the overbought zone. This reflects short-term exhaustion in bullish momentum, aligning with the narrowing range on price. The Chande Momentum Oscillator has slipped into negative territory at -17.00, suggesting that price action is losing steam despite still trading near local highs.
The MACD indicator on the same timeframe shows a fading bullish histogram, with the MACD and signal lines nearing a crossover. This confirms the slowing upside momentum, though no clear bearish reversal has emerged yet.
 MASK price prediction (Source: TradingView)
On the 4-hour chart, the Ichimoku Cloud still offers a supportive structure, with price holding above the baseline and conversion line. However, the leading span is starting to flatten, which could point to neutral momentum unless bulls reclaim higher resistance zones soon.
Bollinger Bands and EMA Structure
 MASK price prediction (Source: TradingView)
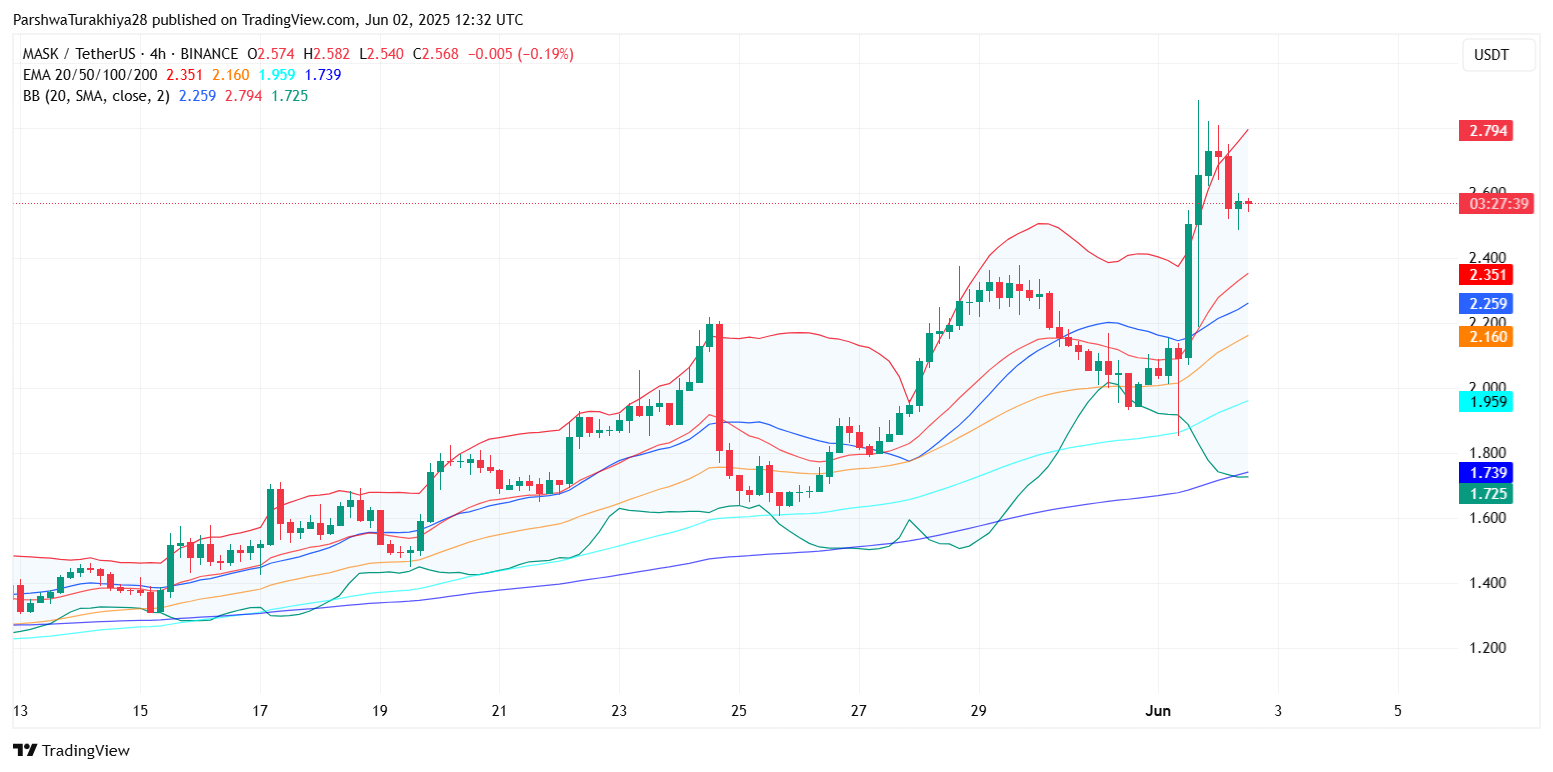
The Bollinger Bands on the 4-hour chart are still wide, reflecting the recent expansion in volatility. The upper band has acted as dynamic resistance, with the current price now resting near the middle band, around $2.56. A close above this level would support further continuation toward the $2.70–$2.80 region, while failure to hold may drag MASK back toward the $2.35–$2.30 support cluster.
Price remains above all major exponential moving averages, including the 20/50/100/200 EMA on both the 30-minute and 4-hour charts. The 20 EMA on the 4-hour is located at $2.35 and now serves as the first dynamic support to monitor. A break below this could open the door toward deeper retracement levels.
Why Mask Network Price Going Down Today?
 MASK price prediction (Source: TradingView)
The question of why Mask Network prices are going down today can be attributed to a combination of factors. Primarily, technical exhaustion after a rapid vertical move has triggered profit-taking. Additionally, momentum indicators are weakening, with the MACD histogram flattening and short-term RSI rolling over from overbought zones.
There are no major fundamental triggers for the drop, suggesting that this is a technically-driven consolidation rather than a shift in sentiment. Broader altcoin sentiment remains mixed, with traders rotating capital into lagging assets after MASK’s aggressive run.
Key Support and Resistance Levels
 MASK price prediction (Source: TradingView)
MASK is currently compressing within a minor triangle structure, and traders should watch for a decisive breakout from this range. The technical levels to monitor include:
- Immediate resistance: $2.65 and $2.78
- Primary support: $2.46, followed by $2.30 and $2.07
- Upside breakout target: $2.90–$3.00 (if triangle breaks north)
- Downside risk: $2.20–$2.07 if triangle fails
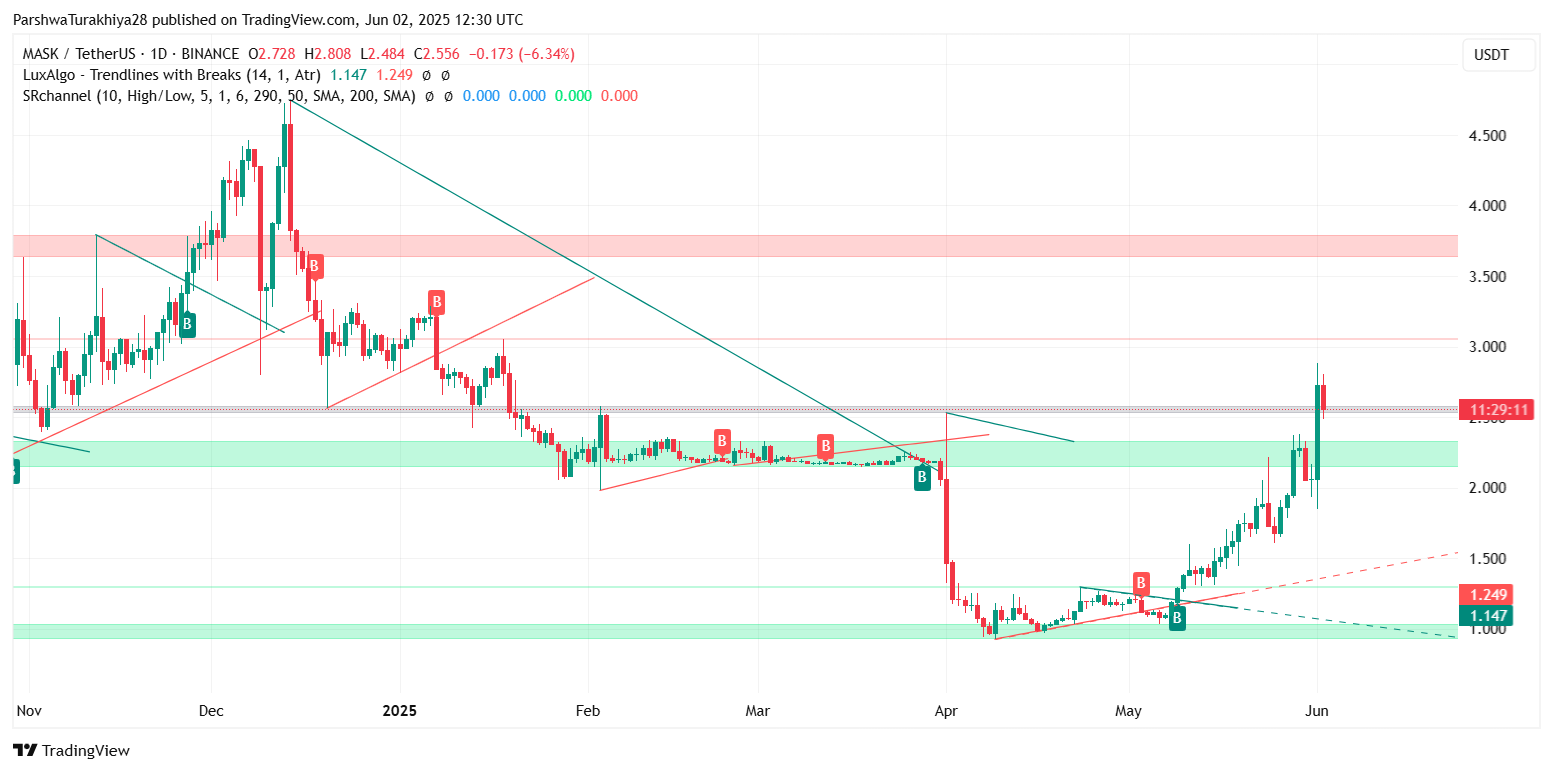
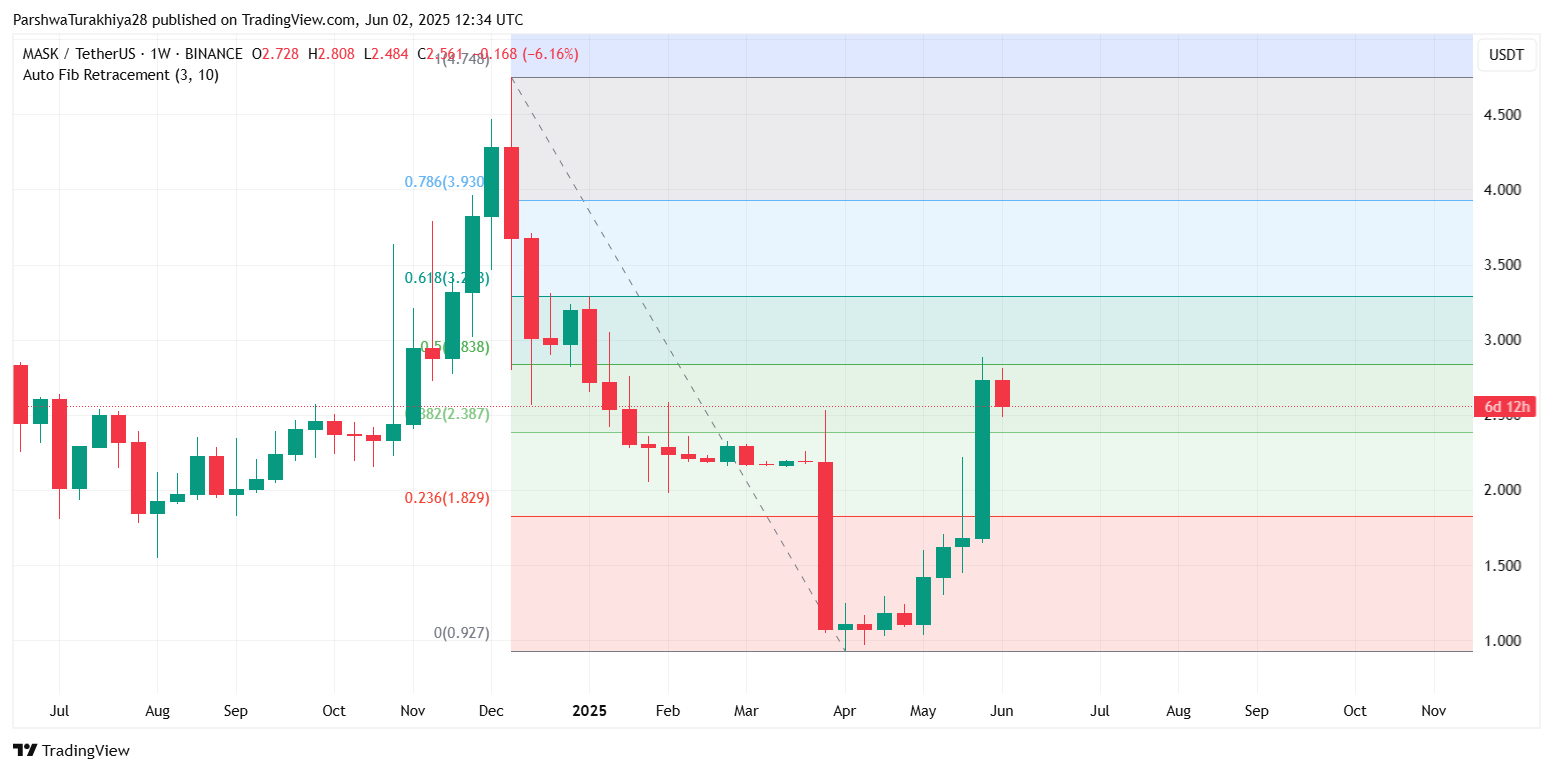
On the weekly chart, the 0.5 Fibonacci retracement level near $2.83 remains the medium-term upside target, while the 0.382 level at $2.38 could act as a buffer in case of short-term corrections.
Final Outlook: Will Bulls Regain Control?
 MASK price prediction (Source: TradingView)
MASK’s rally has cooled off, but the broader structure remains bullish as long as price holds above the $2.30–$2.35 demand zone. The price is now coiling between trendlines and could see a volatile move as traders await confirmation of breakout or breakdown.
In conclusion, while Mask Network price volatility is currently contained, traders should prepare for a potential spike in momentum as price compresses near key inflection points. A break above $2.65 could reignite bullish momentum, while a drop below $2.30 would signal short-term weakness. For now, the Mask Network price update suggests caution as momentum indicators reset and consolidation deepens.
Mask Network (MASK) Forecast Table for 3rd June 2025
| Indicator | 30-Min Chart | 4-Hour Chart | Daily Chart |
| Trend | Sideways to mild bearish | Bullish continuation (pausing) | Recovering but facing rejection |
| RSI | 48.5 (neutral zone) | 55.2 (fading bullish strength) | 61.4 (moderately bullish) |
| MACD | Weak crossover forming | Histogram flattening | Bullish but slowing |
| Ichimoku Cloud | Price near base/kijun line | Above cloud (supportive) | Inside cloud |
| Bollinger Bands | Contracting | Still wide (volatile) | Upper band rejection zone |
| EMA Cluster | Price above all major EMAs | 20/50 EMA support at $2.35 | 100 EMA near $2.16 |
| Support Levels | $2.46, $2.30, $2.07 | $2.35, $2.20 | $2.00, $1.82 |
| Resistance Levels | $2.65, $2.78, $2.90 | $2.83 (Fib 0.5), $3.00 | $3.23 (Fib 0.618) |
| Bias | Watch for breakout of triangle | Neutral to bullish above $2.35 | Medium-term upside intact |
Disclaimer: The information presented in this article is for informational and educational purposes only. The article does not constitute financial advice or advice of any kind. Coin Edition is not responsible for any losses incurred as a result of the utilization of content, products, or services mentioned. Readers are advised to exercise caution before taking any action related to the company.