

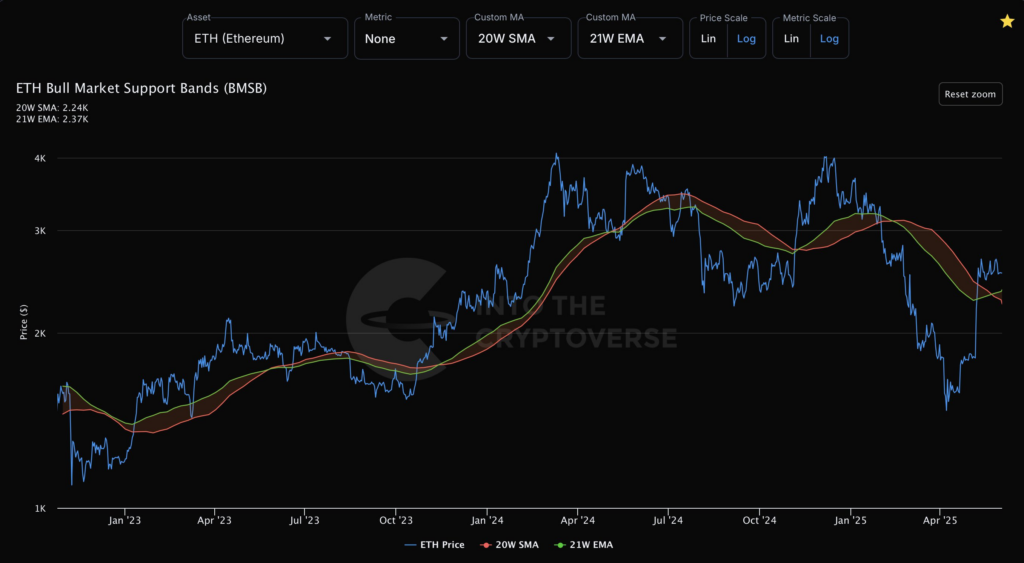
- Ethereum price action is currently focused on important 20W SMA and 21W EMA support zones near $2240 and $2370 levels.
- Crossing above the $2370 level may spark buying interest while falling below $2240 could signal further downside risk.
- Traders monitor these averages closely as they often mark zones of stability before new trends emerge in Ethereum markets.
Ethereum (ETH) price trends show significant volatility through 2023 and 2025. The 20-week simple moving average (SMA) and 21-week exponential moving average (EMA) define key support bands. These averages provide a window into Ethereum’s price action and market sentiment. ETH price oscillations relative to these bands reveal critical support and resistance levels. These metrics are essential for traders analyzing Ethereum’s bullish momentum and downturns.
 Source: X
ETH Price Trends and Moving Averages Analysis
Ethereum’s price experienced notable growth reaching highs near $4,000 between late 2023 and early 2024. This surge was followed by steep declines below $2,000 in early 2025. The 20W SMA currently stands at $2,240, while the 21W EMA is slightly higher at $2,370. The proximity of these moving averages suggests a consolidation phase. This price band acts as a key support zone where buyers and sellers are actively contesting.
Price movements crossing above or below these averages indicate potential trend changes. For instance, Ethereum’s price dipped beneath the 21W EMA multiple times in 2025, signaling bearish pressure. Conversely, rebounds above these averages could indicate renewed bullish momentum . Market participants use these signals to time entries and exits amid Ethereum’s dynamic price fluctuations.
The Role of Moving Average Support Bands in Market Sentiment
Support bands like the 20W SMA and 21W EMA help measure Ethereum’s market health over medium-term horizons. These averages smooth out daily price noise, offering clearer trend insights. Investors and analysts closely watch when ETH price interacts with these bands to gauge market confidence.
Periods where ETH price stays above the 20W SMA generally reflect sustained buying interest. However, when prices fall below these bands, bearish sentiment tends to increase. In early 2025, ETH’s breach below the 20W SMA coincided with heightened volatility and selling pressure. Subsequent recoveries show attempts to regain footing, often facing resistance near the 21W EMA.
These moving averages serve as psychological levels that affect trading decisions. The overlapping of 20W SMA and 21W EMA zones creates a “support band” where prices often stabilize before deciding future direction. This band’s integrity remains vital for Ethereum’s price outlook.
Implications of Current ETH Support Band Dynamics for Traders
The current support band levels near $2,240 (20W SMA) and $2,370 (21W EMA) have become focal points in June 2025. Traders will closely watch how ETH price behaves within this range. A decisive move above the 21W EMA could lead to increased buying momentum and potential retests of higher resistance levels near $3,000.
Alternatively, failure to hold above the 20W SMA could trigger further downside risks. Below this level, Ethereum might test psychological support near $2,000 or lower. These outcomes depend heavily on broader market conditions, including macroeconomic factors and crypto sector trends.
The ongoing contest between buyers and sellers at these moving average bands highlights Ethereum’s fragile recovery. Market participants face the pivotal question: Will Ethereum sustain gains above key moving averages or retreat to lower support zones? The answer will shape ETH’s trajectory in the coming months.