

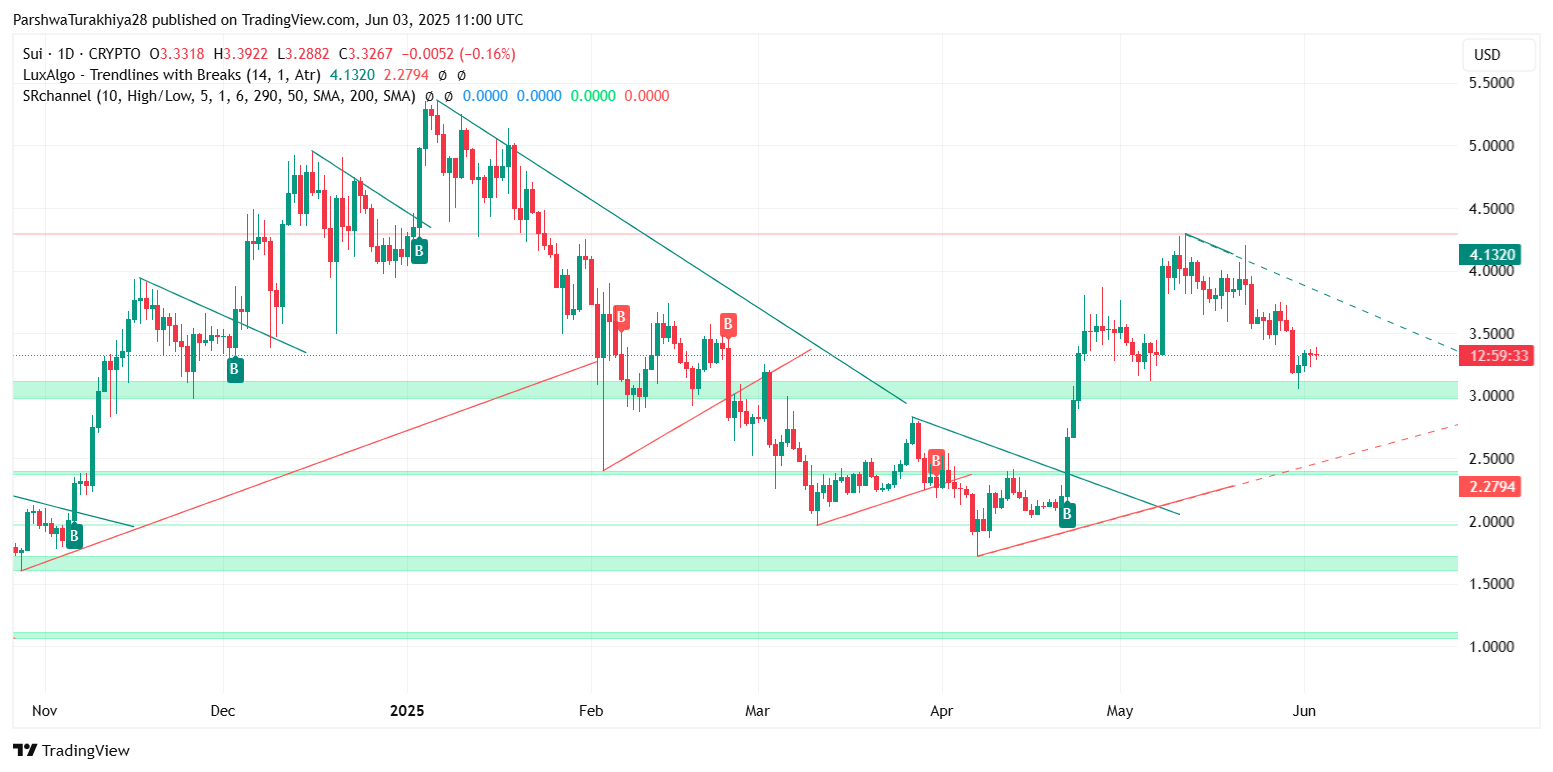
After facing heavy selloffs last week, SUI price today is attempting to stabilize above the $3.30 level. As of the latest 30-minute candle, SUI price is trading near $3.32, recovering modestly from a recent dip toward $3.10. The asset has now entered a key compression zone that could determine whether bulls regain strength or if sellers reclaim control heading into midweek.
What’s Happening With SUI’s Price?
 SUI price dynamics (Source: TradingView)
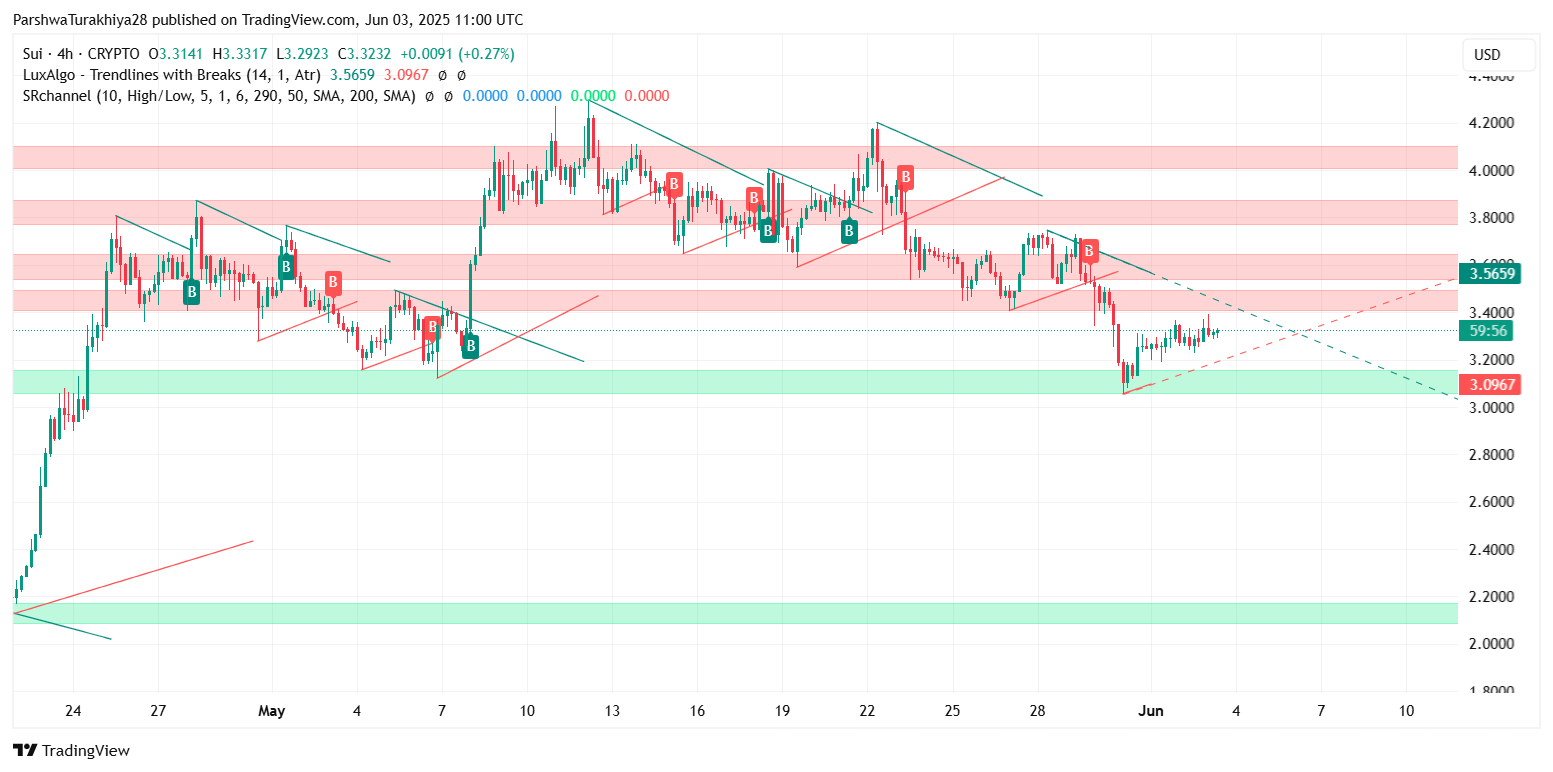
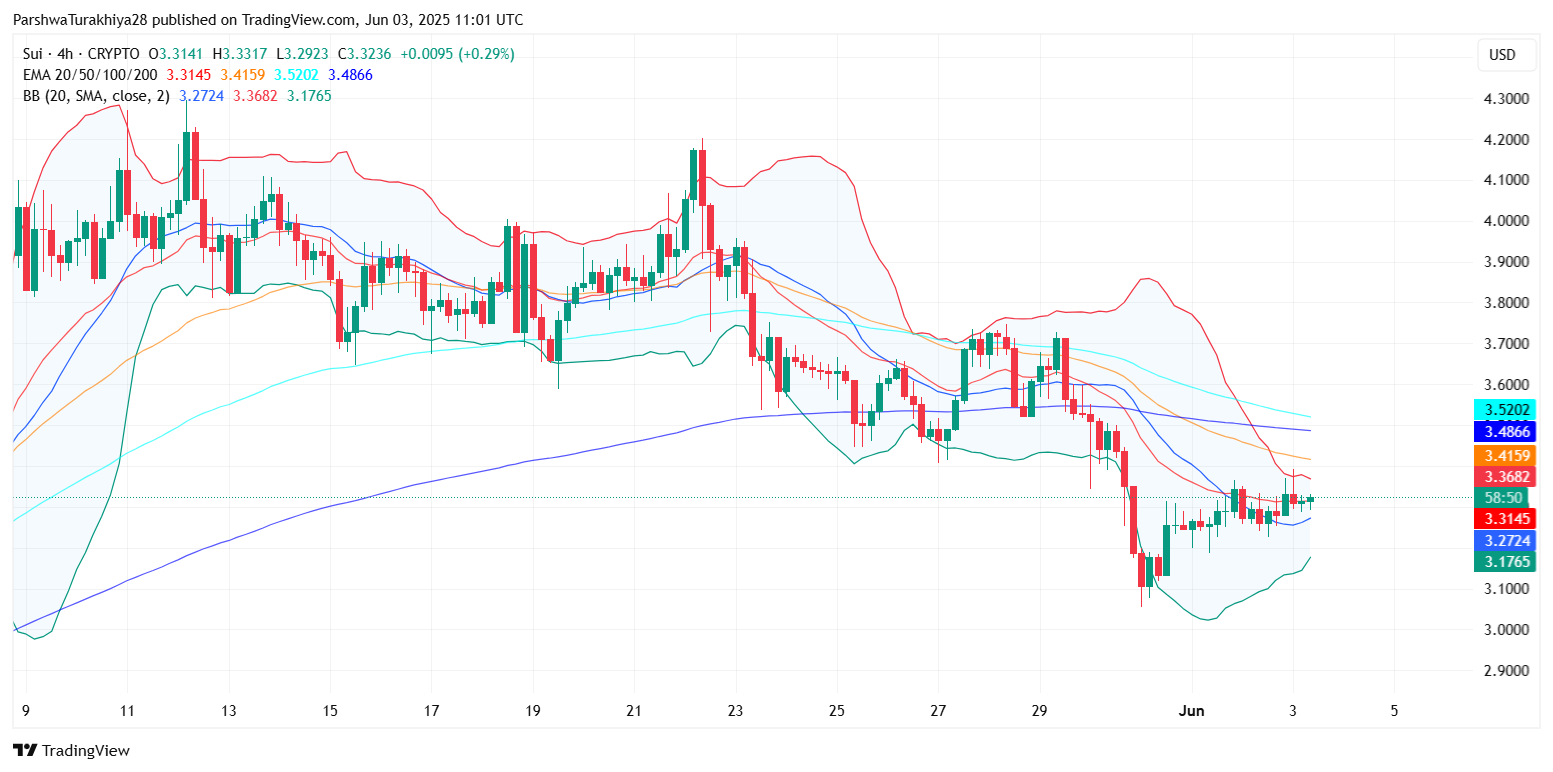
The SUI price update reflects a sideways structure with a slight bullish tilt following a bounce off the $3.10 demand zone. The 4-hour chart reveals an active descending wedge breakout structure, which remains incomplete as price action tests the upper edge near $3.32–$3.36. However, the recovery is facing friction from multiple EMA resistances stacked tightly just above the current zone, notably the 50 and 100 EMAs at $3.41 and $3.52 respectively.
 SUI price dynamics (Source: TradingView)
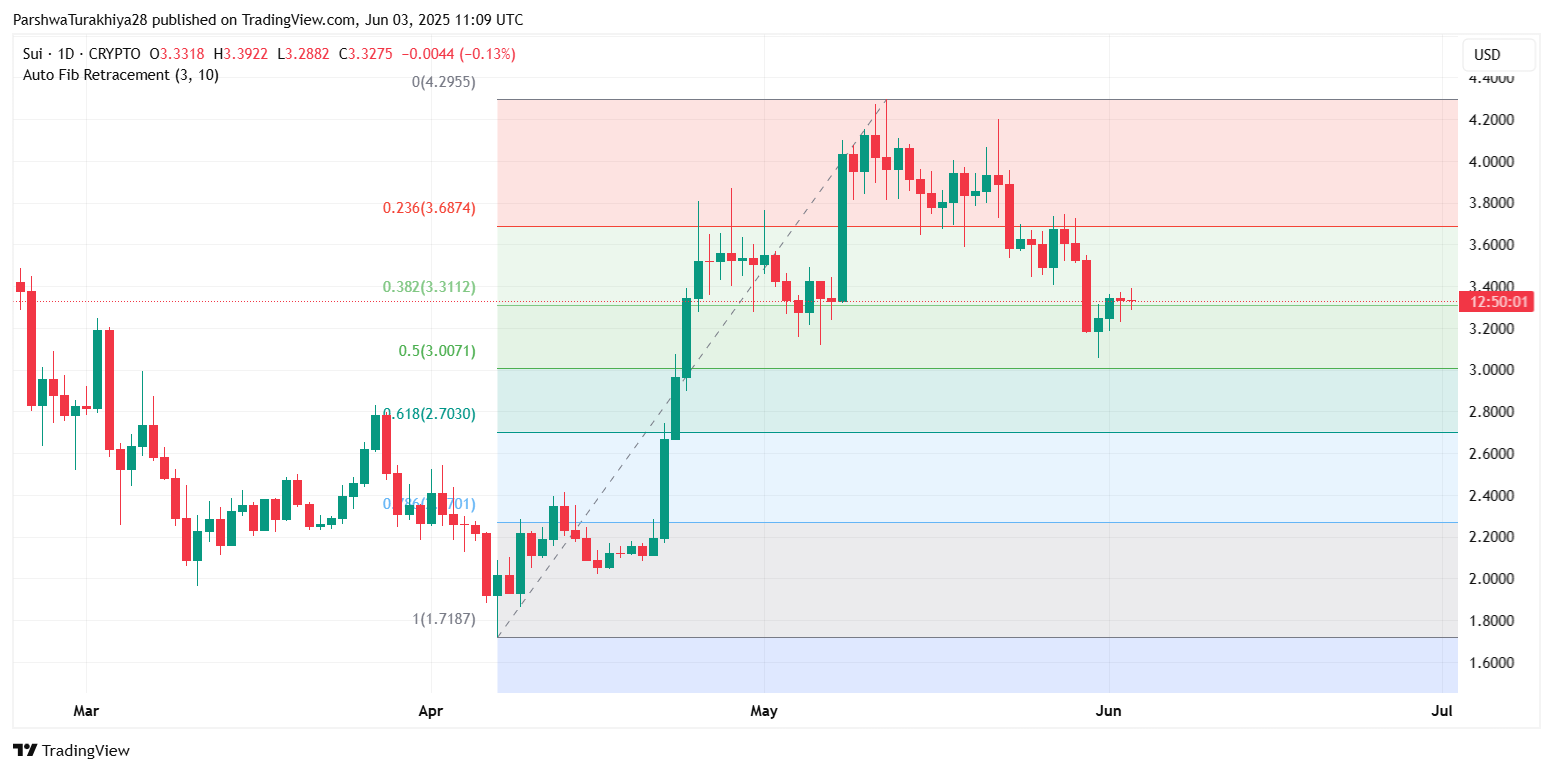
Moreover, the 0.382 Fibonacci level from the April–May impulse sits right at $3.31, making it a pivotal retracement anchor. A decisive close above this zone could open the path toward $3.56, but rejection here would reinforce bearish continuation within the broader downtrend from the $4.29 high.
RSI, MACD Show Cautious Optimism in Lower Timeframes
 SUI price dynamics (Source: TradingView)
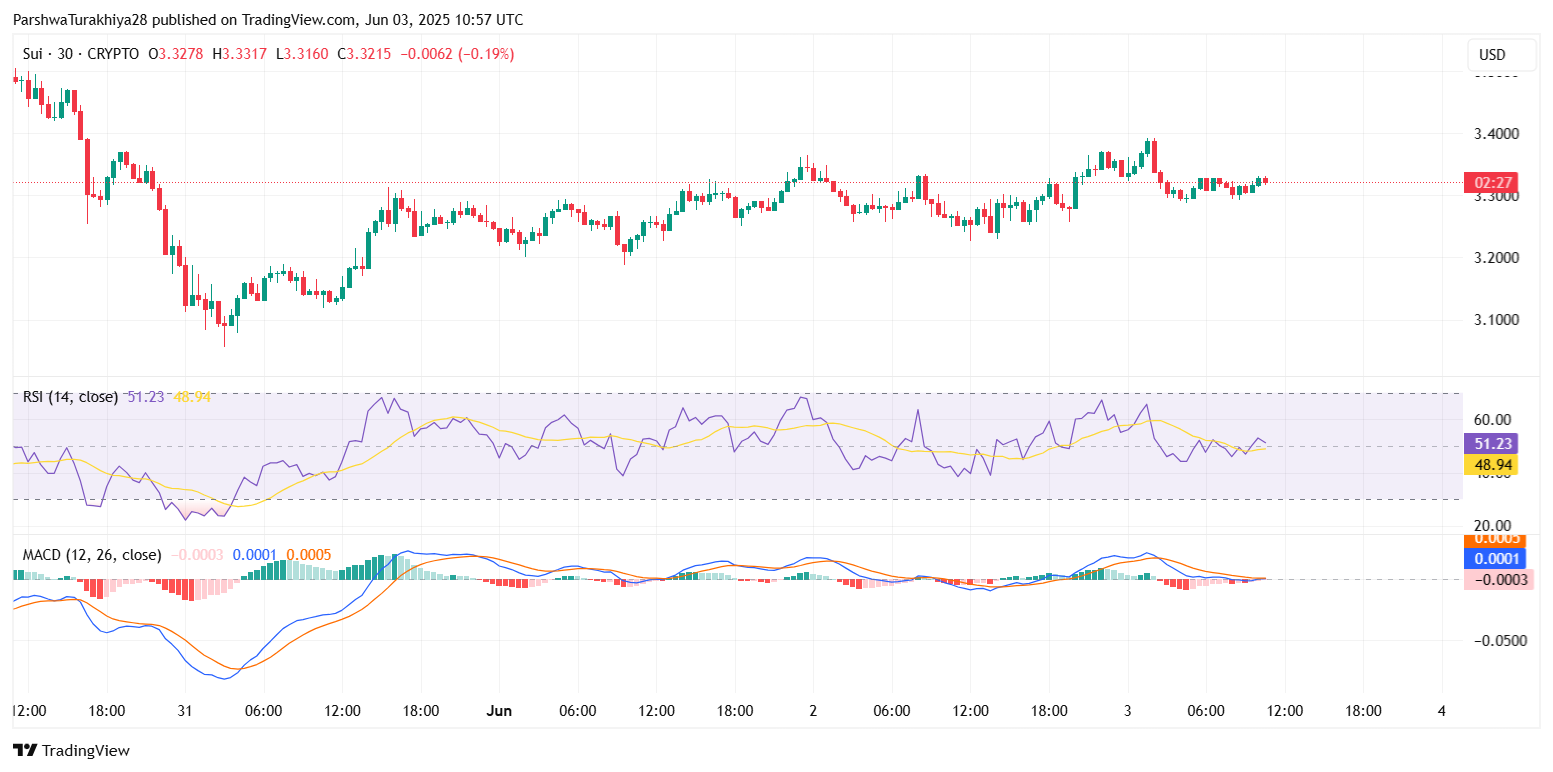
On the 30-minute chart, RSI is currently hovering near 51.2, indicating balanced momentum but no clear directional commitment yet. MACD remains marginally positive, with the histogram printing mild bullish divergence as the signal and MACD lines flatten. This reflects cautious optimism, but no strong conviction from bulls at this stage.
In the 4-hour timeframe, RSI is still below 50, while the MACD is attempting a weak bullish crossover. Until RSI reclaims 55+ levels with strong MACD expansion, upside moves are likely to remain capped.
Ichimoku and Stoch RSI Support a Bounce, but Not Without Risks
 SUI price dynamics (Source: TradingView)
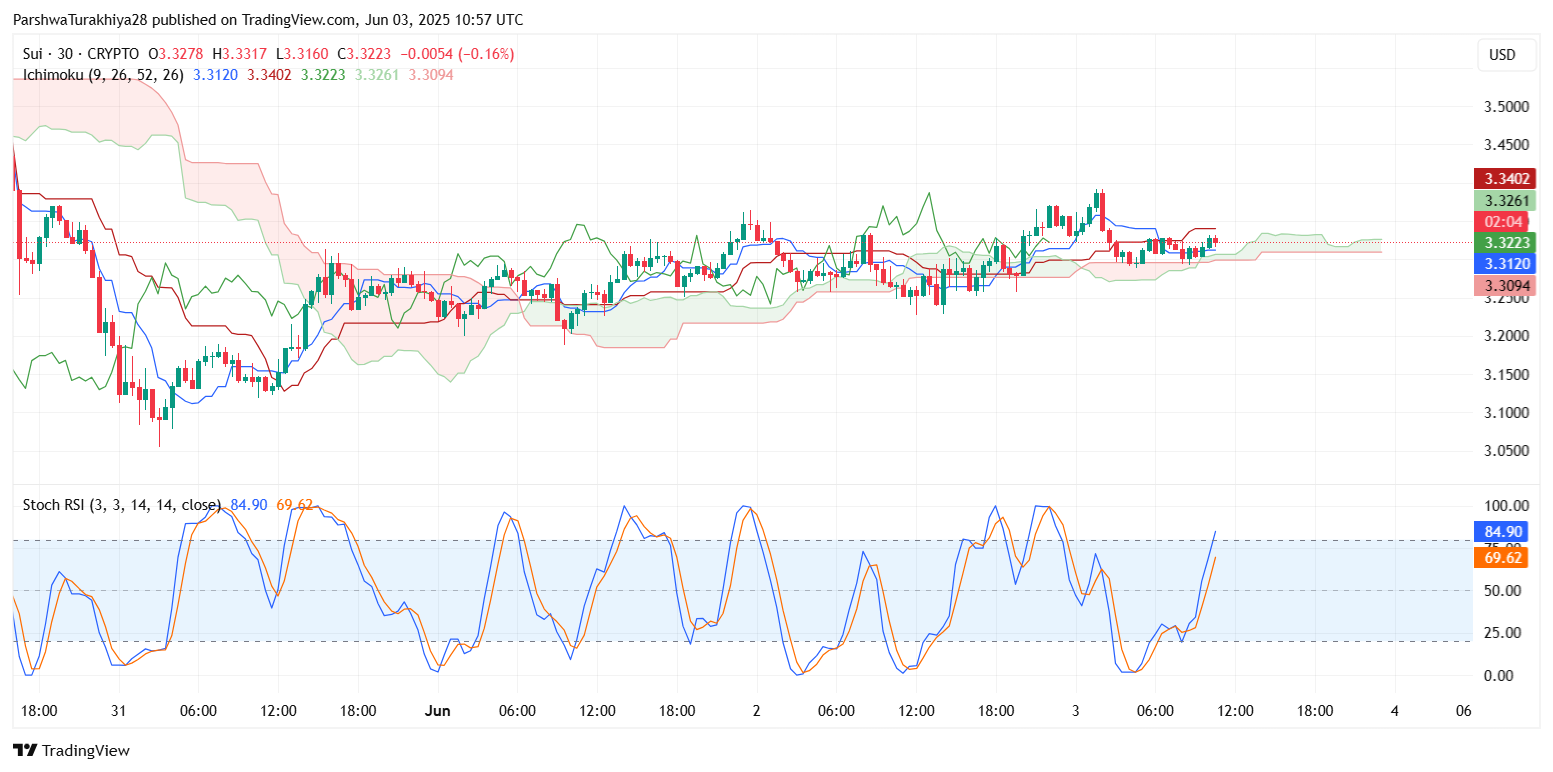
Ichimoku Cloud analysis on the 30-minute chart suggests short-term neutral-to-bullish structure. The price is inside the cloud with leading span A and B flattening, while the Tenkan and Kijun lines have converged just below $3.33. A clean breakout from the cloud top near $3.34 could trigger a short rally. However, thin cloud structure ahead signals potential for volatility.
Stochastic RSI has already rebounded from oversold levels and is now nearing overbought territory again, hinting that momentum may be approaching exhaustion unless reinforced by strong price action.
Bollinger Bands and EMAs Indicate a Key Rejection Zone
 SUI price dynamics (Source: TradingView)
The 4-hour Bollinger Bands show SUI price action nudging the mid-band but not yet testing the upper band near $3.41. The compression of the bands and convergence with EMA resistance points to a high-stakes moment. If SUI breaks above $3.41 with volume, it could quickly spike toward $3.52 and even $3.56.
Conversely, a failure here would reintroduce bearish pressure, with downside levels around $3.20 and $3.10 likely to be tested again.
Why SUI Price Going Down Today
 SUI price dynamics (Source: TradingView)
The question why SUI price going down today hinges on whether short-term buyers can sustain momentum above $3.30. The modest rise today follows a broader market recovery and a technical bounce from key support. However, resistance zones remain unbroken, and a shift in market sentiment or Bitcoin’s movement could quickly reverse the intraday gain.
Until the descending structure breaks cleanly with price establishing above $3.36–$3.41, rallies are likely to face consistent selling pressure.
Short-Term Outlook: Range Bias With Bullish Tilt
 SUI price dynamics (Source: TradingView)
As it stands, the broader trend remains bearish, but near-term price behavior shows potential for a minor bullish breakout if the $3.31–$3.36 zone holds. For the 4th of June, SUI could range between $3.20 and $3.41, with any breakout needing confirmation above the 100 EMA.
If bulls manage to break above $3.41 and close above $3.52, a spike toward $3.70 becomes realistic. But if price loses the $3.28–$3.30 band again, downside targets include $3.10 and $3.00 psychological support.
Technical Forecast Summary for June 04 2025
| Indicator | Signal | Key Levels |
| RSI (30-min) | Neutral | Hovering near 51 |
| MACD (30-min) | Weak Bullish | Slight positive crossover |
| Ichimoku | Neutral | Price inside cloud |
| Bollinger Bands | Tightening | Mid-band near $3.32 |
| Support Levels | Strong | $3.28, $3.10, $3.00 |
| Resistance Levels | Strong | $3.41, $3.52, $3.70 |
Disclaimer: The information presented in this article is for informational and educational purposes only. The article does not constitute financial advice or advice of any kind. Coin Edition is not responsible for any losses incurred as a result of the utilization of content, products, or services mentioned. Readers are advised to exercise caution before taking any action related to the company.