

After a sharp climb of nearly 8% over the past 24 hours, the SPX6900 price today is holding near $1.1850. This marks a continuation of the uptrend that started in early May, taking SPX from below $0.60 to fresh multi-month highs. Price has now reclaimed key resistance zones and is approaching $1.20, a level that could determine whether further upside unfolds or a pullback emerges near the Fib 0.382 zone.
What’s Happening With SPX6900’s Price?
 SPX6900 price dynamics (Source: TradingView)
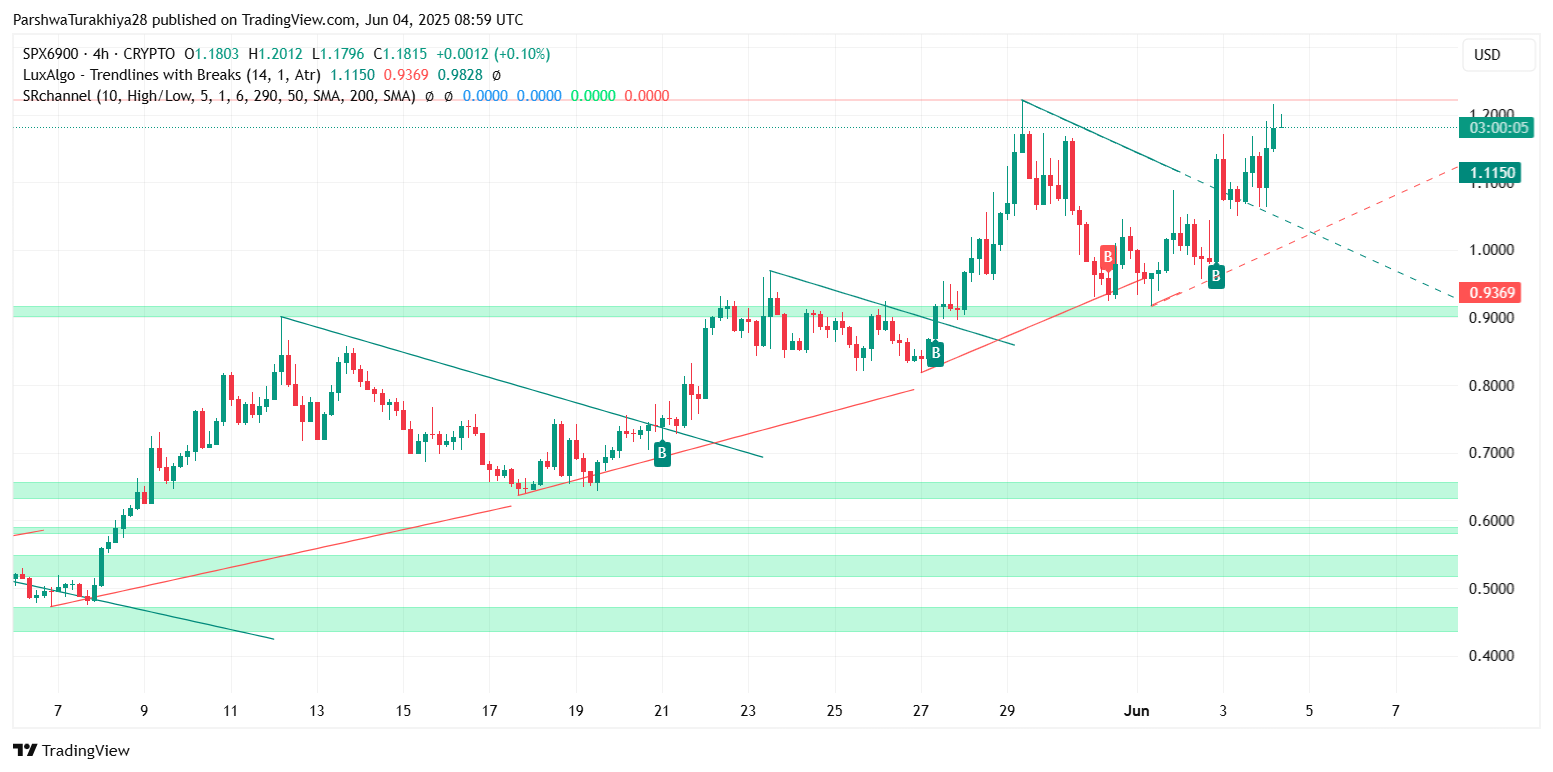
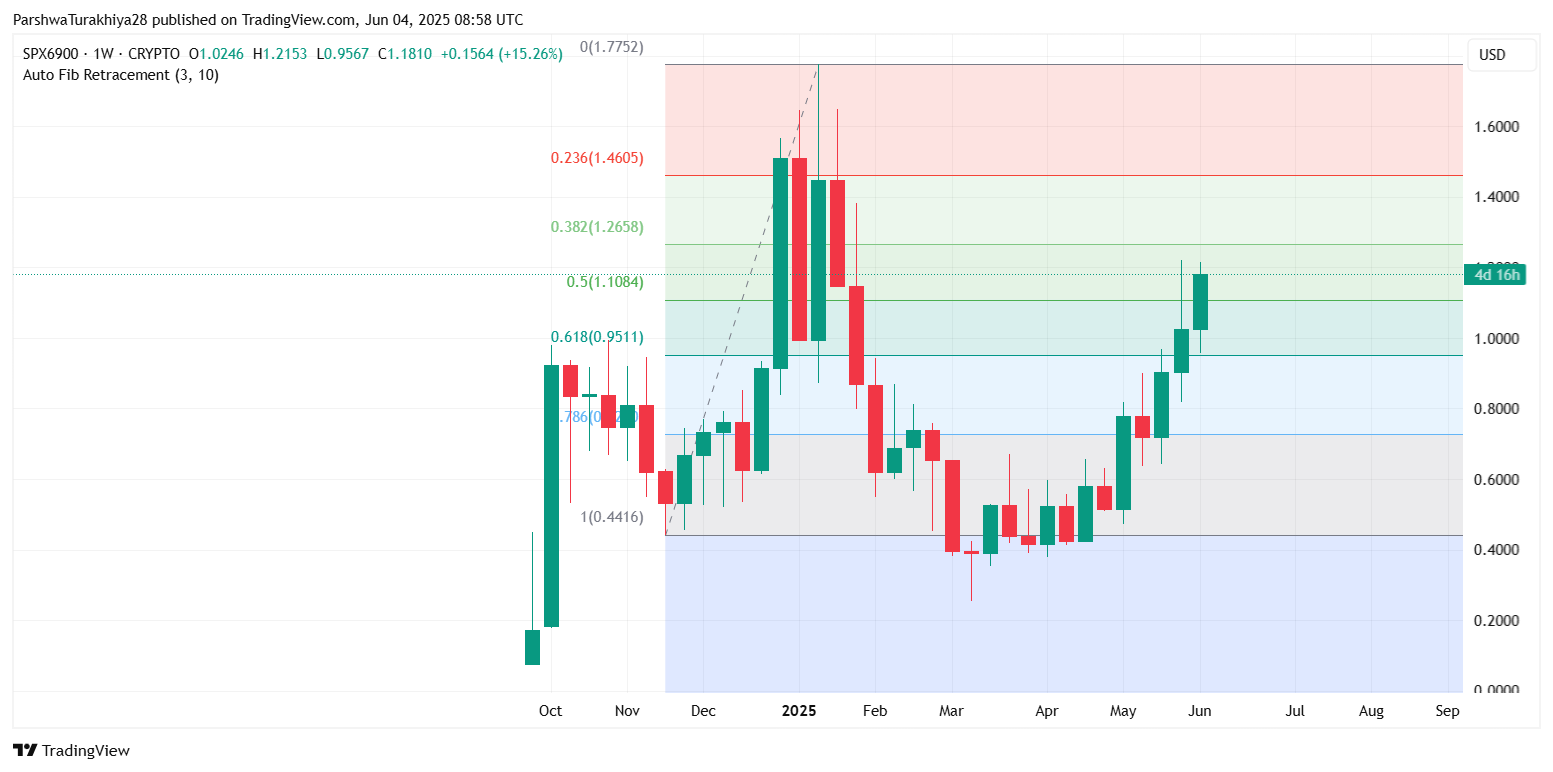
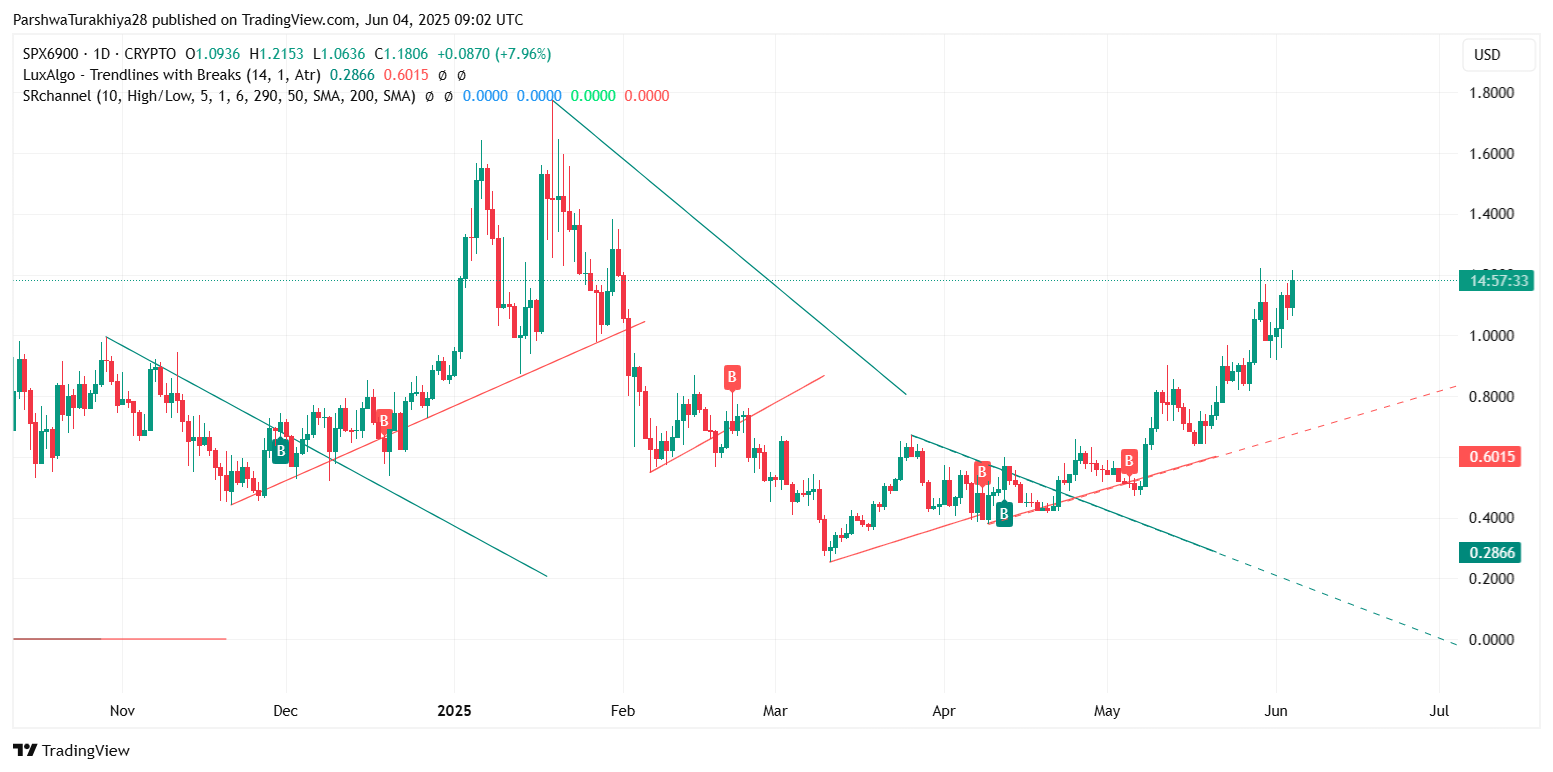
SPX has delivered consistent higher highs and higher lows on both daily and 4-hour charts. The breakout above $1.15 came on rising volume, with buyers flipping previous resistance into support. A bullish structure is visible on the daily chart, where SPX6900 price action now hovers above the 50% Fibonacci retracement at $1.1084, while targeting the next retracement zone at $1.2658 (Fib 0.382).
 SPX6900 price dynamics (Source: TradingView)
On the weekly chart, the 50% and 61.8% retracement levels at $1.108 and $0.951 respectively have formed a reliable consolidation base since late April. With a fresh weekly close above both levels, bulls have reclaimed dominance. This aligns with the recent rally visible on the 30-minute and 4-hour charts where SPX has broken multiple descending trendlines.
Momentum Builds As Technical Indicators Confirm Strength
 SPX6900 price dynamics (Source: TradingView)
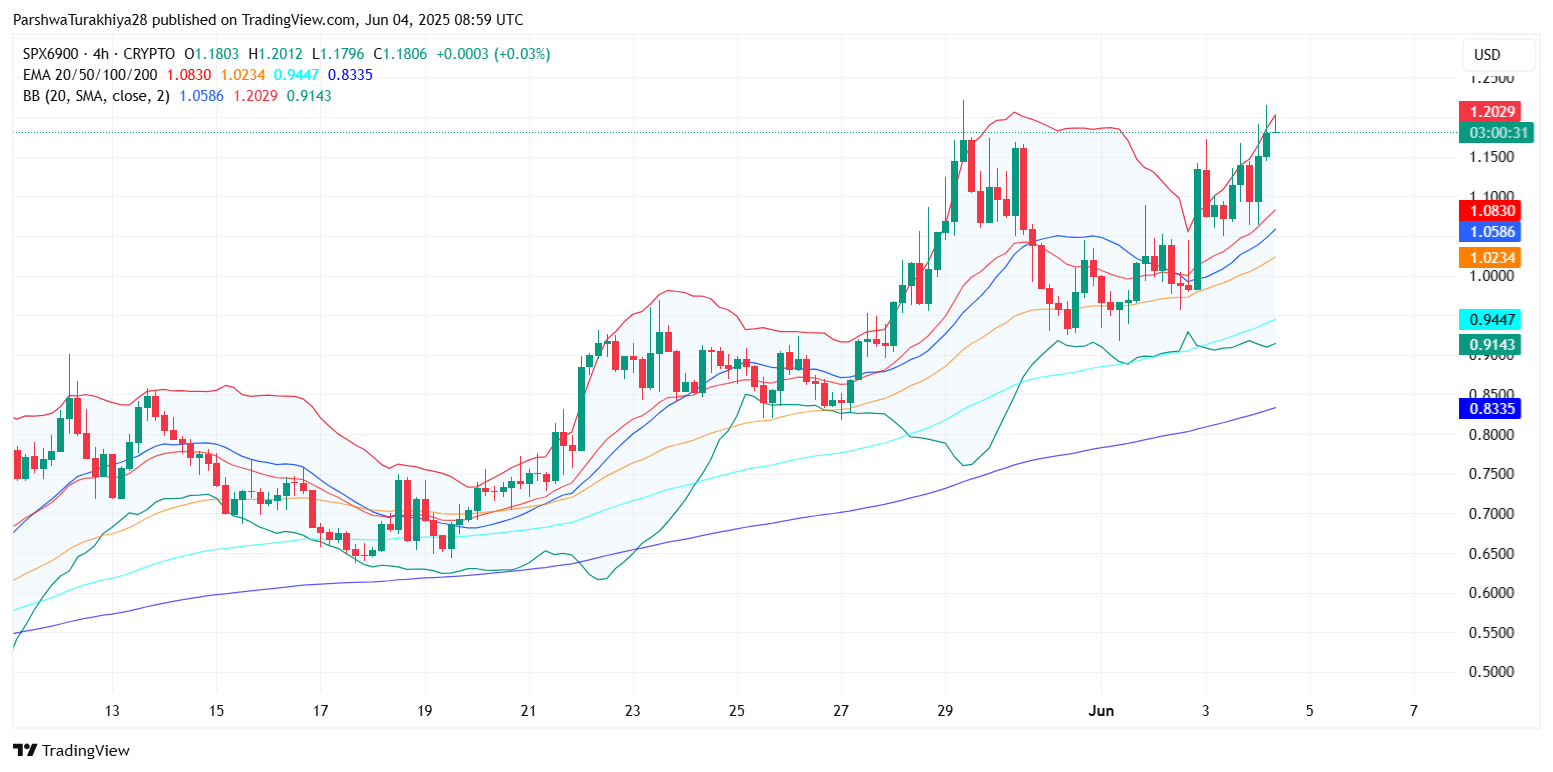
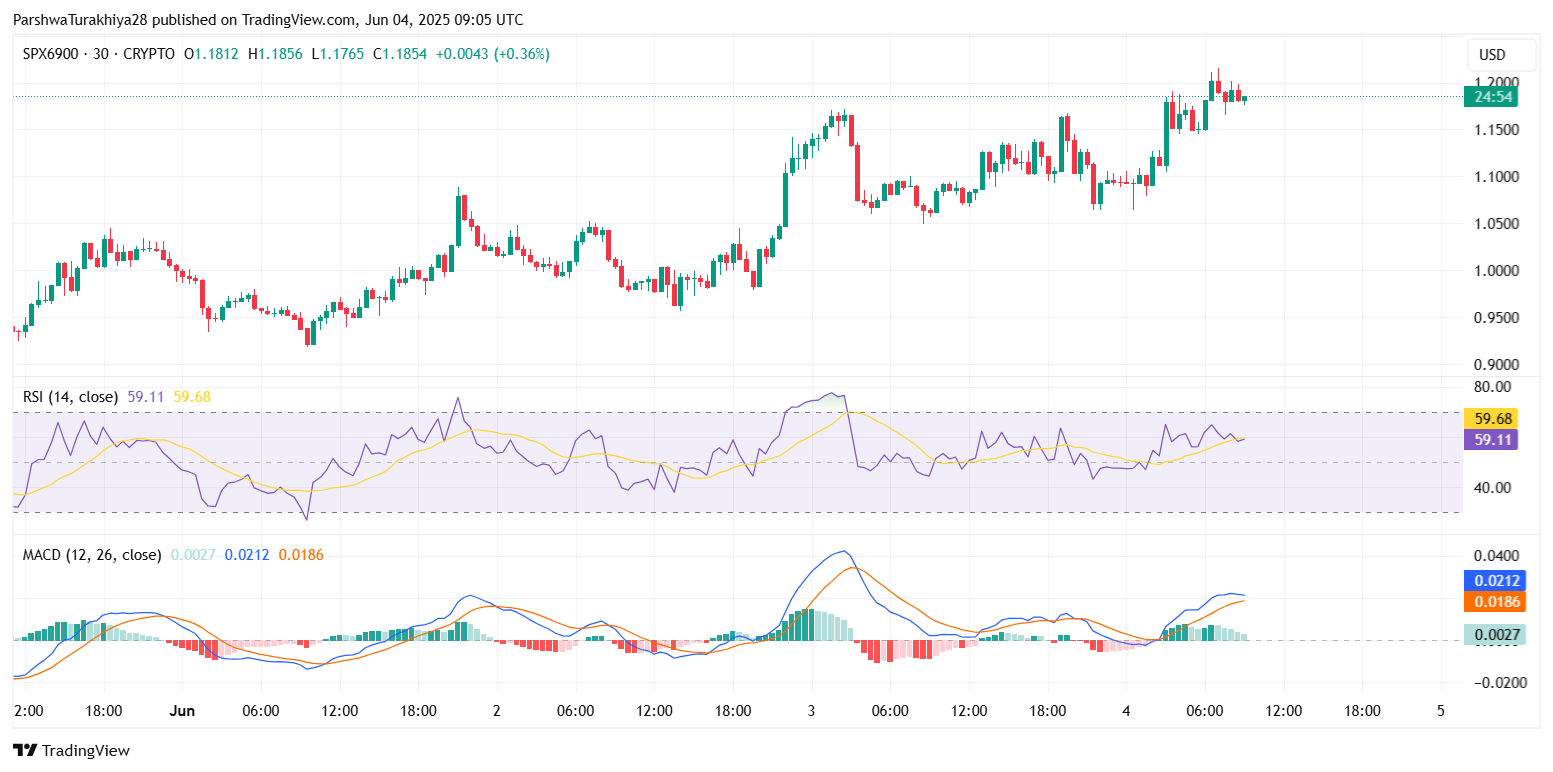
The 4-hour chart shows SPX trading well above its 20, 50, and 100 EMAs, currently sitting at $1.0830, $1.0234, and $0.9447 respectively. These moving averages are now sloping upward, confirming bullish momentum. The MACD histogram is widening, with the blue MACD line staying above the orange signal line, pointing toward continued upward momentum.
 SPX6900 price dynamics (Source: TradingView)
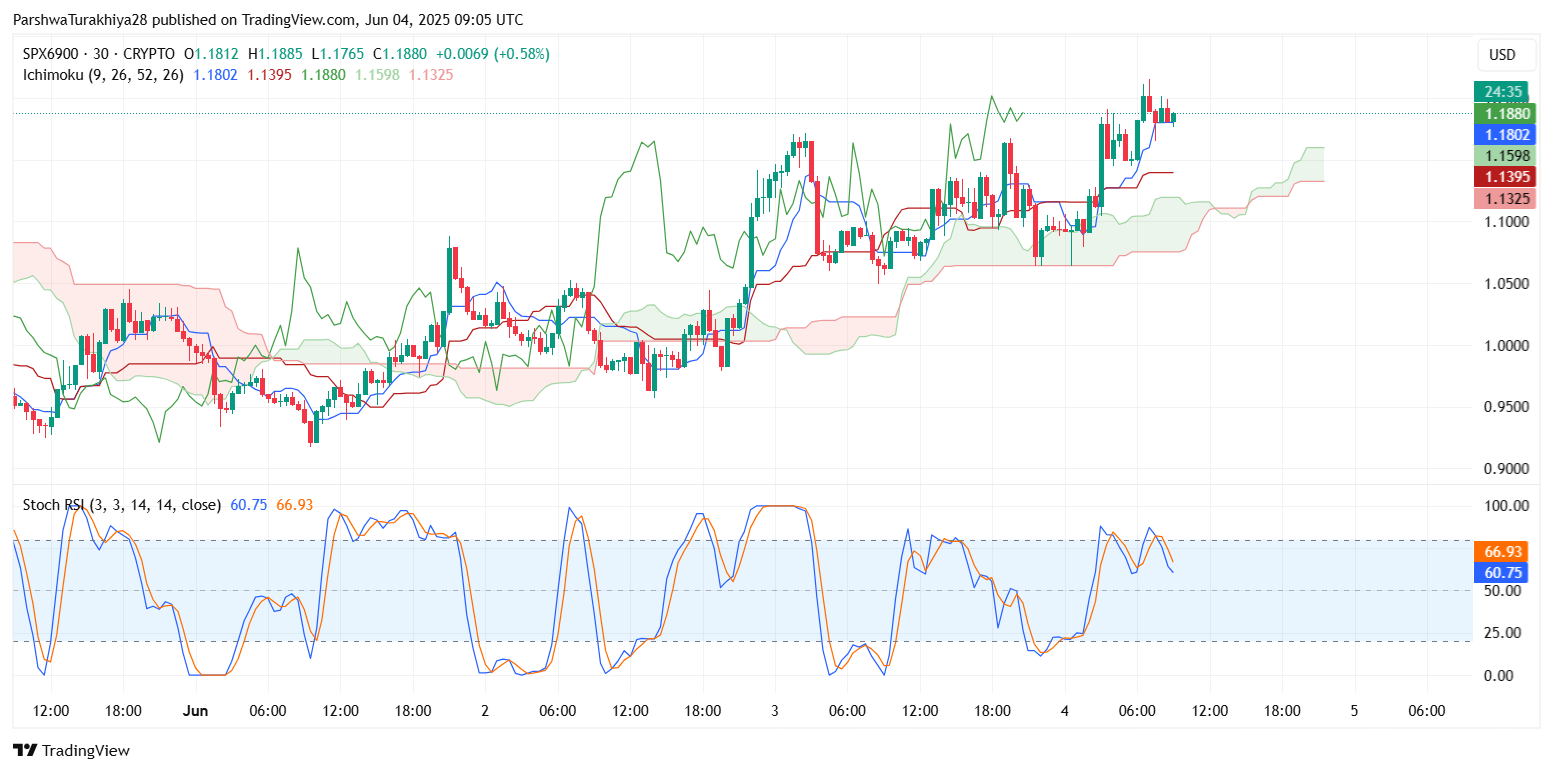
RSI sits near 59 on the 30-minute timeframe, indicating that SPX is approaching overbought territory but still has room before exhaustion. Stochastic RSI readings near 66.9 and 60.7 also support this near-term momentum bias, though a mild pullback is not ruled out.
 SPX6900 price dynamics (Source: TradingView)
SPX6900 price update also shows consistent Bollinger Band expansion. Price is currently hugging the upper band on both 4-hour and daily timeframes, suggesting an ongoing trend rather than a reversal. The Ichimoku Cloud adds to the bullish structure with price above the cloud, Tenkan-Sen and Kijun-Sen rising in parallel, and the lagging span confirming trend continuation.
Why is the SPX6900 Price Going Up Today?
 SPX6900 price dynamics (Source: TradingView)
The reason why SPX6900 price went up today can be traced to multiple bullish technical developments. First, a decisive break above the key horizontal resistance at $1.15 unlocked upside liquidity. This level had previously acted as a ceiling throughout May, and the recent breakout triggered stop-losses and fresh long interest.
Second, trendline resistance from mid-April was decisively broken on June 3, fueling upward momentum. This coincided with a golden cross formation on lower timeframes, where the 20 EMA crossed above the 100 EMA. Additionally, Bollinger Band compression on June 2 set the stage for the recent SPX6900 price spikes, which followed with strong volume and rapid price expansion.
Moreover, bullish formations like ascending triangles and trendline support zones between $1.05 and $1.07 provided clear structure for bulls to build on. With no significant resistance until the $1.22–$1.26 band, buyers remain in control for now.
Short-Term Forecast: Can SPX6900 Reach $1.26?
 SPX6900 price dynamics (Source: TradingView)
Looking ahead, SPX appears poised to retest the $1.20–$1.22 resistance zone. A successful breakout above $1.2220 would open the path toward the next Fib resistance near $1.26 and then the key 0.236 level at $1.4605. However, traders should be cautious if price fails to close above $1.20 with volume confirmation.
On the downside, support is building around $1.12 and $1.08, followed by stronger structure near the $1.00 psychological level. A drop below $1.0697 trendline support could lead to consolidation back to the 20 EMA near $1.08.
Given current positioning above major EMAs, bullish MACD posture, and RSI stability, the SPX6900 price volatility is expected to increase into June 5 as price compresses just below the breakout zone.
SPX6900 Forecast Table: June 04
| Indicator / Zone | Level / Signal | Insight |
| Resistance 1 | $1.2220 | Intraday breakout trigger |
| Resistance 2 | $1.2658 | Fib 0.382 resistance target |
| Support 1 | $1.1084 | Fib 0.5 retracement, short-term base |
| Support 2 | $1.0697 | Trendline support zone |
| RSI (30-min) | 59.1 | Moderately bullish |
| MACD Histogram | Rising | Bullish continuation |
| 20/50 EMA (4H) | $1.0830 / $1.0234 | Dynamic support |
| Bollinger Bands (4H) | Expanding | Increased volatility expected |
| Ichimoku Cloud (30-min) | Price above cloud | Uptrend intact |
Disclaimer: The information presented in this article is for informational and educational purposes only. The article does not constitute financial advice or advice of any kind. Coin Edition is not responsible for any losses incurred as a result of the utilization of content, products, or services mentioned. Readers are advised to exercise caution before taking any action related to the company.