

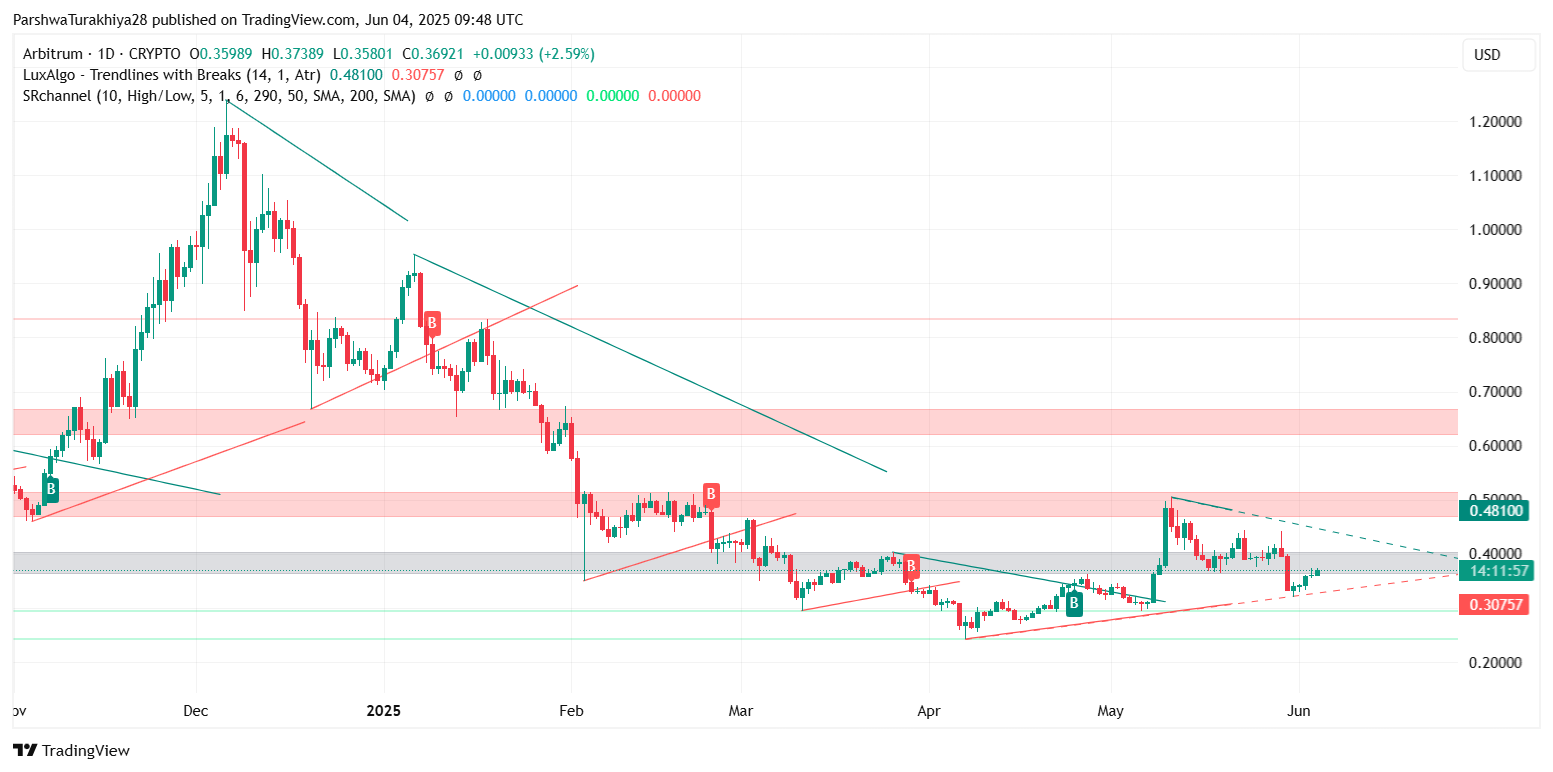
The Arbitrum price today is trading around $0.3690, showing mild gains of 0.45% on the day. After a recent bounce from the $0.33 support zone, ARB is attempting to reclaim key levels, though upward momentum is starting to encounter resistance near the $0.38–$0.39 band. The broader structure shows signs of early trend reversal, but short-term indicators suggest that bulls must defend recent gains to prevent a return to lower consolidation ranges.
What’s Happening with Arbitrum’s Price?
 Arbitrum price dynamics (Source: TradingView)
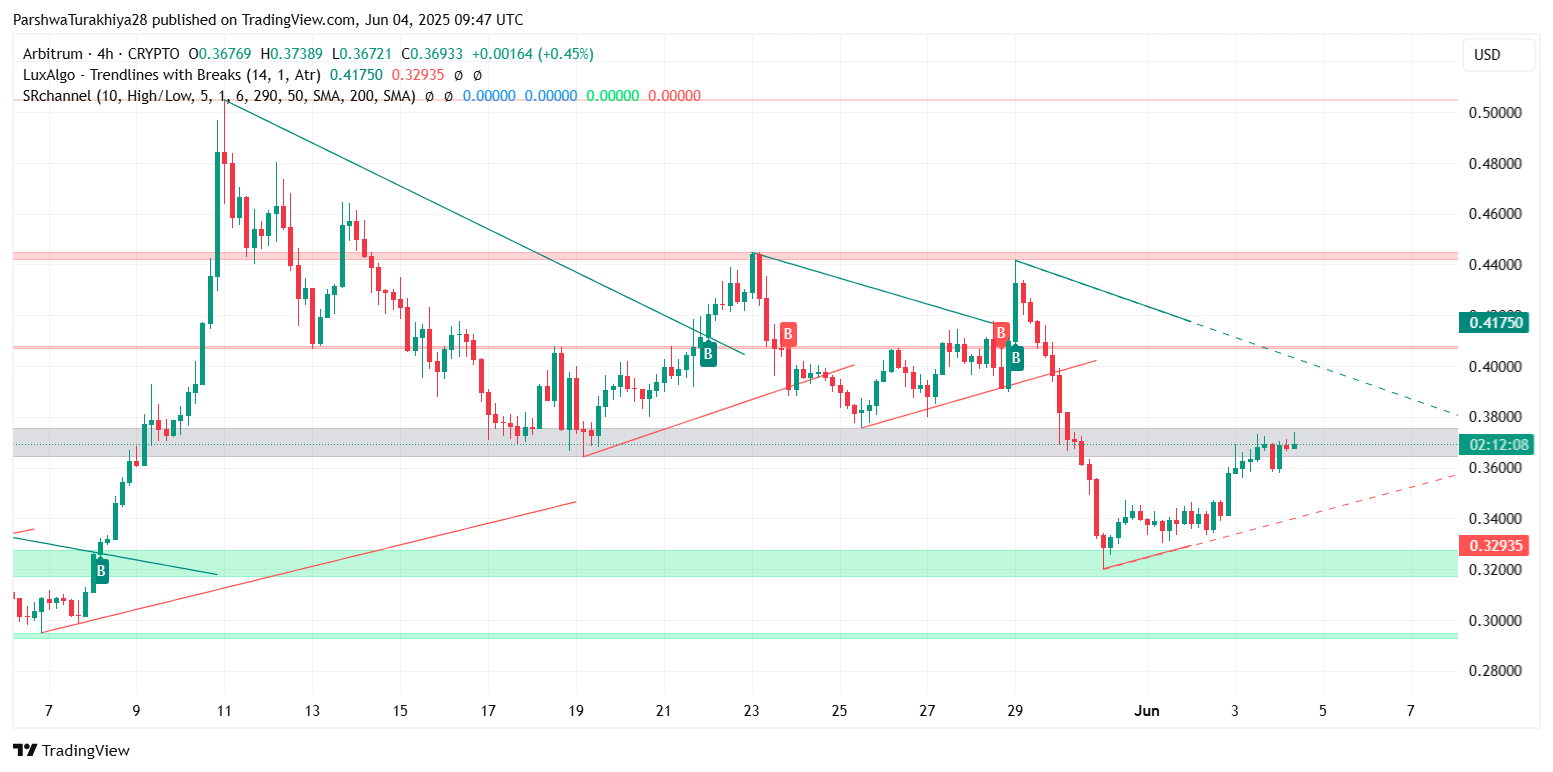
The Arbitrum price action over the past week shows a steady climb from the $0.32 support base, with a rising wedge pattern visible on the 4-hour chart. Price is currently consolidating just beneath the grey resistance zone between $0.3750 and $0.3800, where previous rallies have been capped.
ARB has broken above a short-term descending trendline, shifting the near-term sentiment in favor of the bulls. However, this breakout has yet to see strong volume confirmation, making the move vulnerable to rejection without follow-through. Key overhead levels to watch include $0.3810 and $0.3940.
RSI, MACD, and Bollinger Bands Indicate Cautious Optimism
 Arbitrum price dynamics (Source: TradingView)
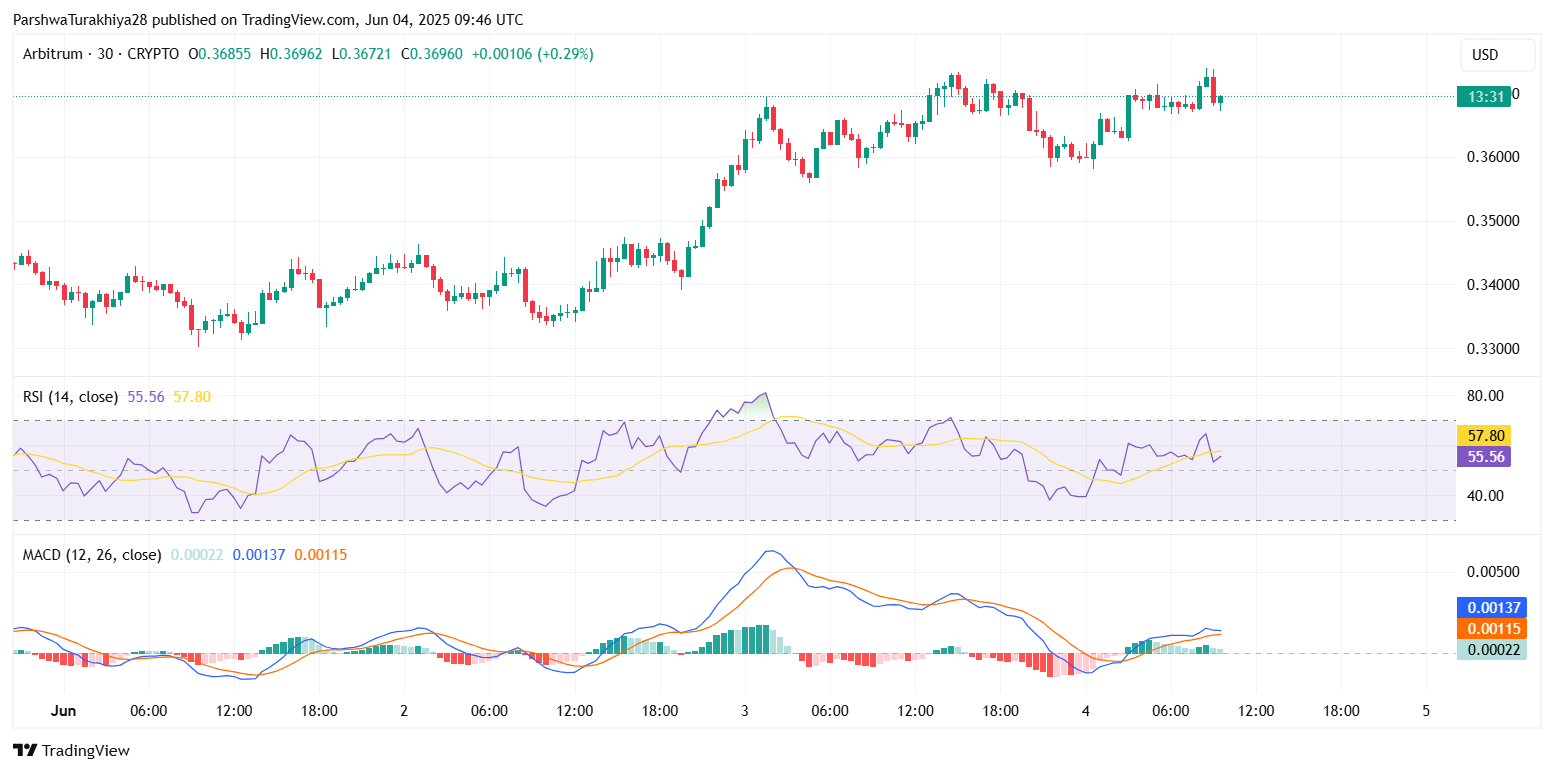
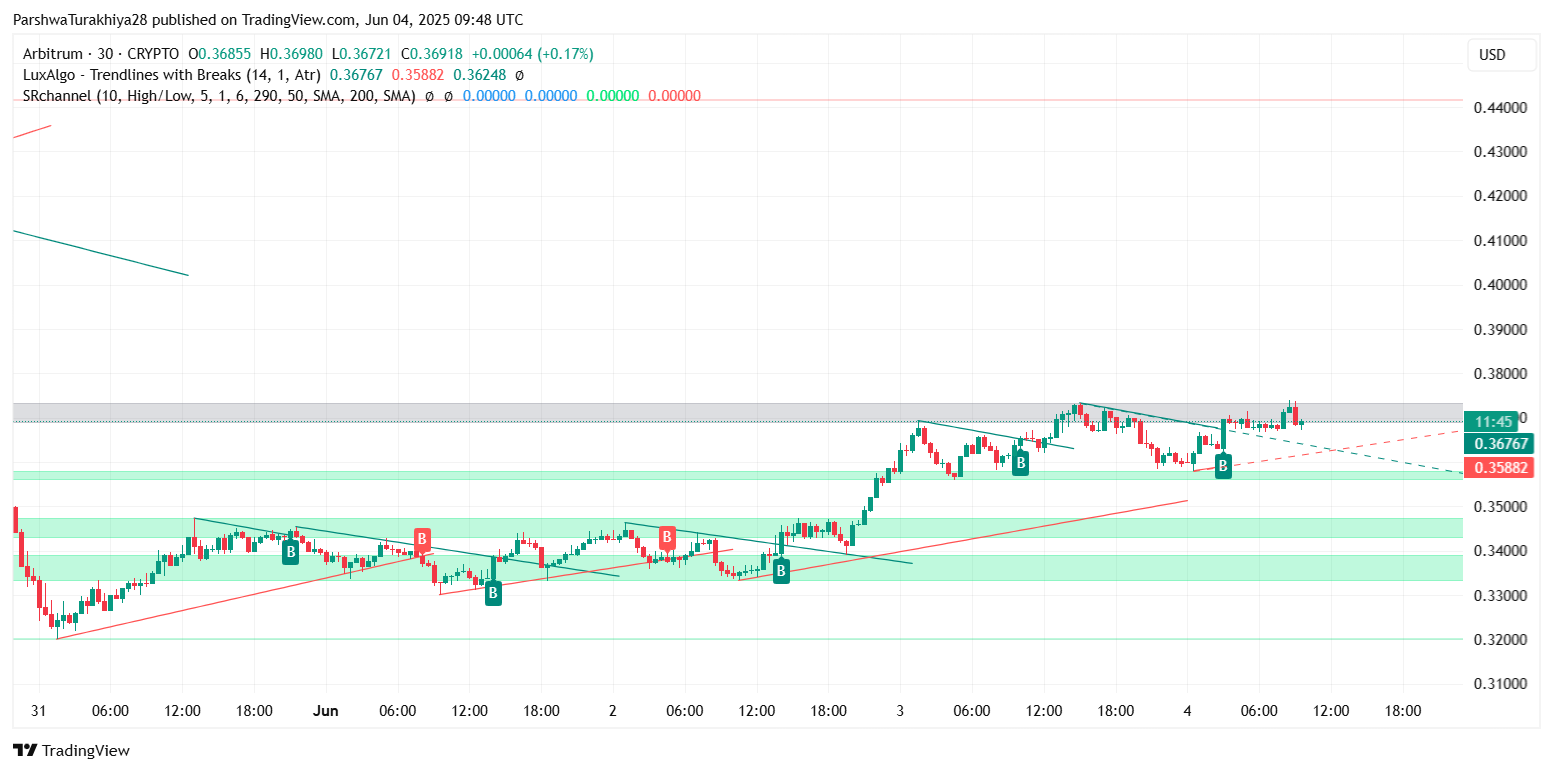
On the 30-minute chart, the RSI is at 57.8, signaling moderate bullish momentum but with room for further upside. The Stoch RSI has pulled back from overbought territory, now at 50.52, suggesting the market may be preparing for its next leg after consolidation.
Meanwhile, the MACD histogram has crossed into positive territory, and both MACD lines are trending upward. These signals support a cautiously bullish outlook, though the gains remain limited unless ARB clears the $0.38 level with strength.
 Arbitrum price dynamics (Source: TradingView)
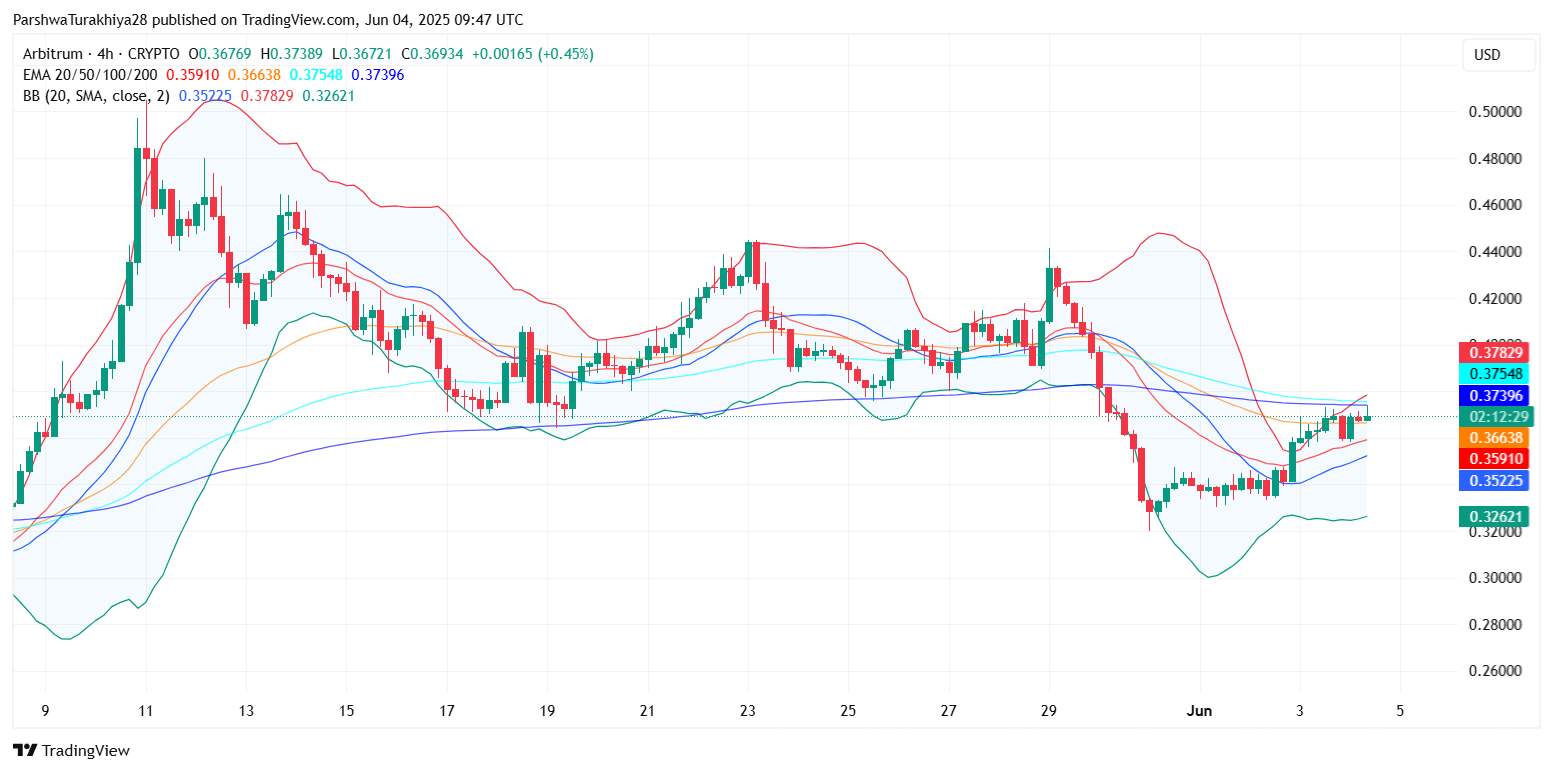
Bollinger Bands on the 4-hour chart are narrowing, indicating reduced Arbitrum price volatility and the potential for a volatility expansion soon. Price is currently pressing against the upper band, but the middle band (20 SMA) near $0.3660 acts as immediate intraday support.
Ichimoku Cloud and Fibonacci Levels Strengthen Bullish Bias
 Arbitrum price dynamics (Source: TradingView)
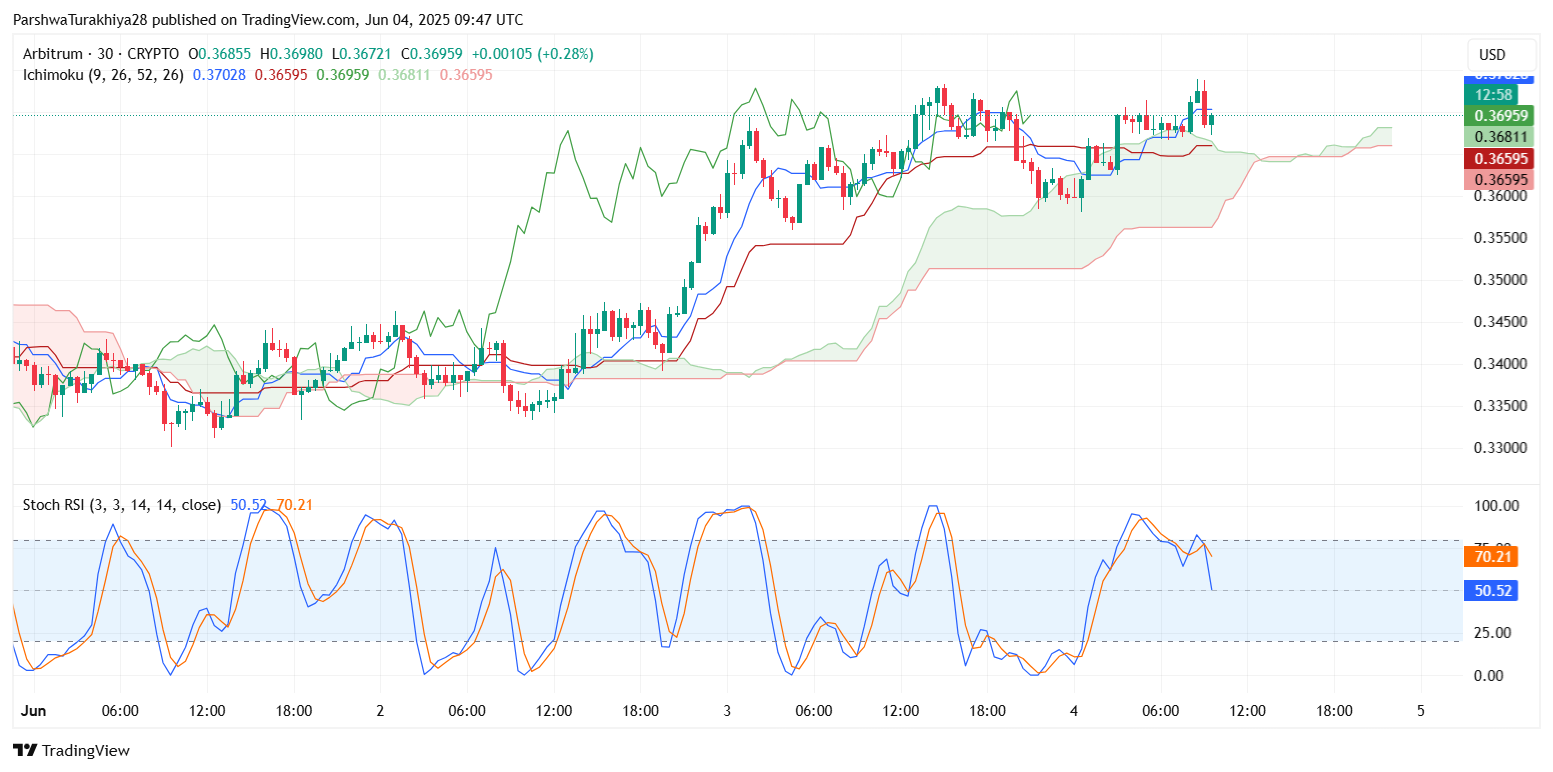
The Ichimoku Cloud on the 4-hour timeframe shows ARB trading above the cloud, with the Tenkan-Sen (blue) and Kijun-Sen (red) lines below price and angling upward. This structure favors a continued upward push unless the price breaks back below the cloud base at $0.3590.
Fibonacci retracement levels on the daily chart show that Arbitrum has reclaimed the 61.8% level ($0.3610) and is now testing the 50% retracement at $0.3739. A decisive breakout above $0.38 could send ARB toward the next Fibonacci level at $0.4175.
Why Arbitrum Price Going Up Today?
 Arbitrum price dynamics (Source: TradingView)
The current upward movement in Arbitrum price today appears driven by technical recovery and increased momentum after ARB reclaimed support above the 200 EMA and broke out of a descending wedge. The Arbitrum price update indicates bullish continuation patterns, supported by MACD crossovers and a gradual rise in the RSI.
 Arbitrum price dynamics (Source: TradingView)
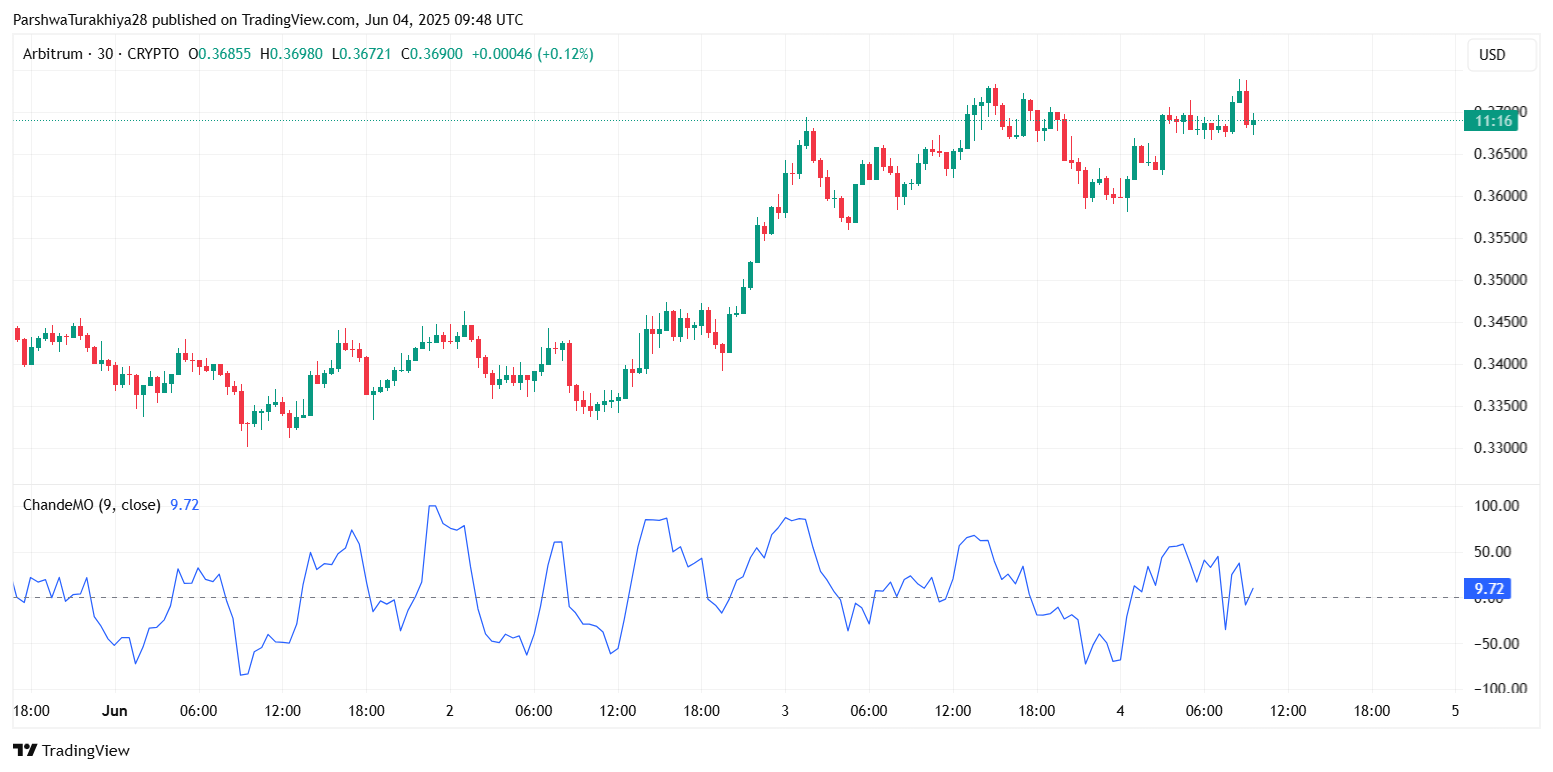
Moreover, the Chande Momentum Oscillator on the 30-minute chart is at +9.72, further supporting bullish momentum. However, without sustained volume, the rally risks fading near the $0.38 barrier.
Short-Term Forecast for June 2025
 Arbitrum price dynamics (Source: TradingView)
Looking ahead, Arbitrum price spikes are possible if bulls manage to reclaim $0.38 on strong volume. A move above this could target $0.4175 (daily Fib resistance) and potentially $0.44. On the downside, if the price loses the $0.3580 support and breaks the rising trendline, bears may push it back to the $0.34 zone.
Traders should watch for confirmation around the breakout zone and closely monitor the RSI and MACD on lower timeframes for early reversal signs.
ARB Technical Forecast Table: June 2025
| Indicator / Zone | Value (USD) | Signal |
| Resistance 1 | 0.3810 | Breakout zone |
| Resistance 2 | 0.4175 | Daily Fibonacci barrier |
| Support 1 | 0.3580 | Trendline Ichimoku base |
| Support 2 | 0.3400 | Lower accumulation zone |
| RSI (30-min) | 57.8 | Mild bullish bias |
| MACD (30-min) | Bullish | Positive crossover |
| Chande Momentum | +9.72 | Early upward momentum |
| Bollinger Band Width | Tightening | Volatility expansion likely |
| Trend Bias | Sideways-Bullish | Watch for breakout signal |
Disclaimer: The information presented in this article is for informational and educational purposes only. The article does not constitute financial advice or advice of any kind. Coin Edition is not responsible for any losses incurred as a result of the utilization of content, products, or services mentioned. Readers are advised to exercise caution before taking any action related to the company.