

The TRON price today is holding steady around $0.2724, showing minor intraday weakness of -0.18%. Despite modest downside pressure, the asset continues to consolidate within a well-defined range just below the $0.2750 resistance zone.
 TRX price dynamics (Source: TradingView)
With short-term momentum indicators turning mixed, traders are watching closely to determine why TRON price is going down today and whether the next breakout will tilt bullish or bearish heading into June 6.
What’s Happening With TRON’s Price?
 TRX price dynamics (Source: TradingView)
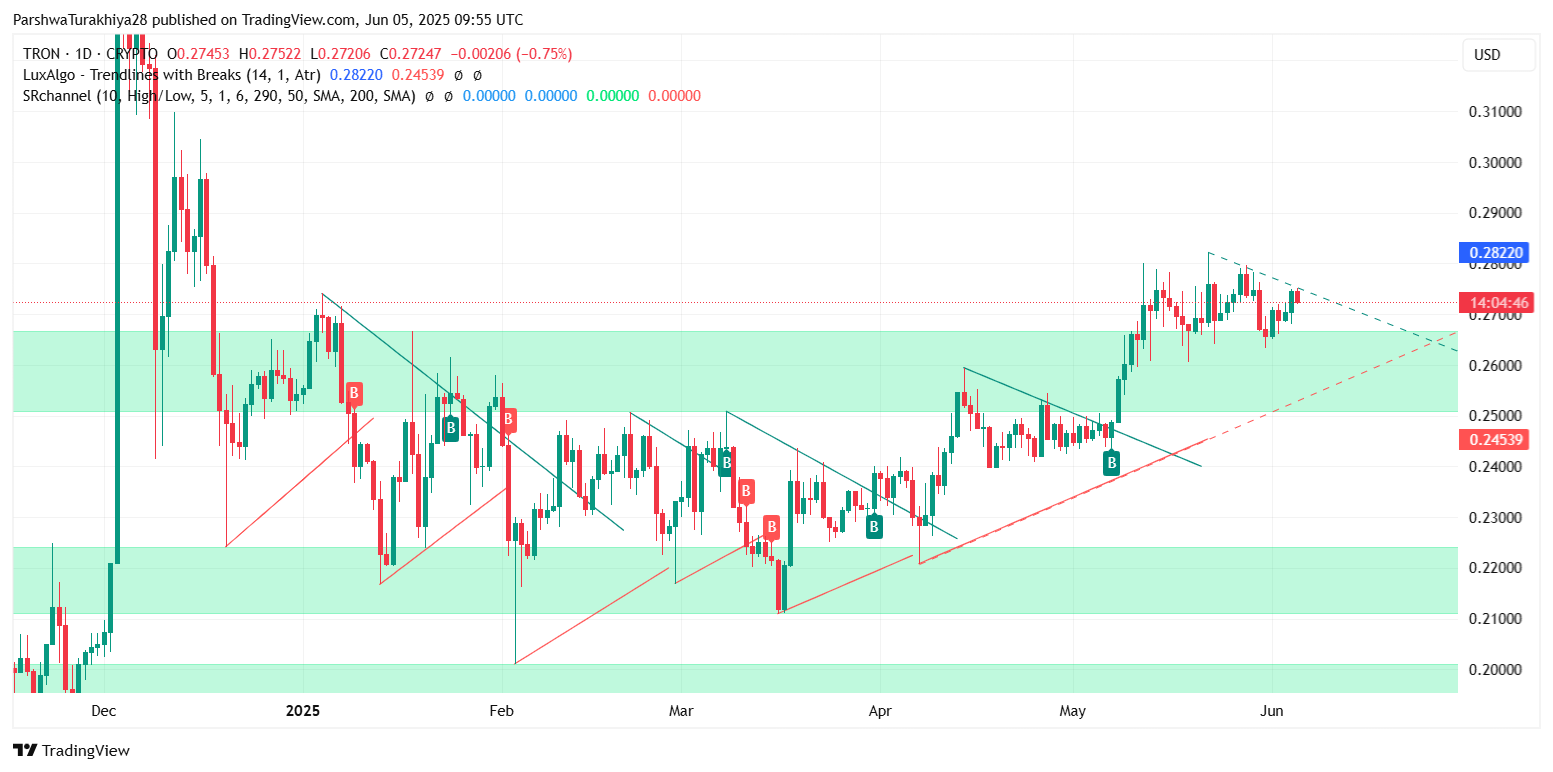
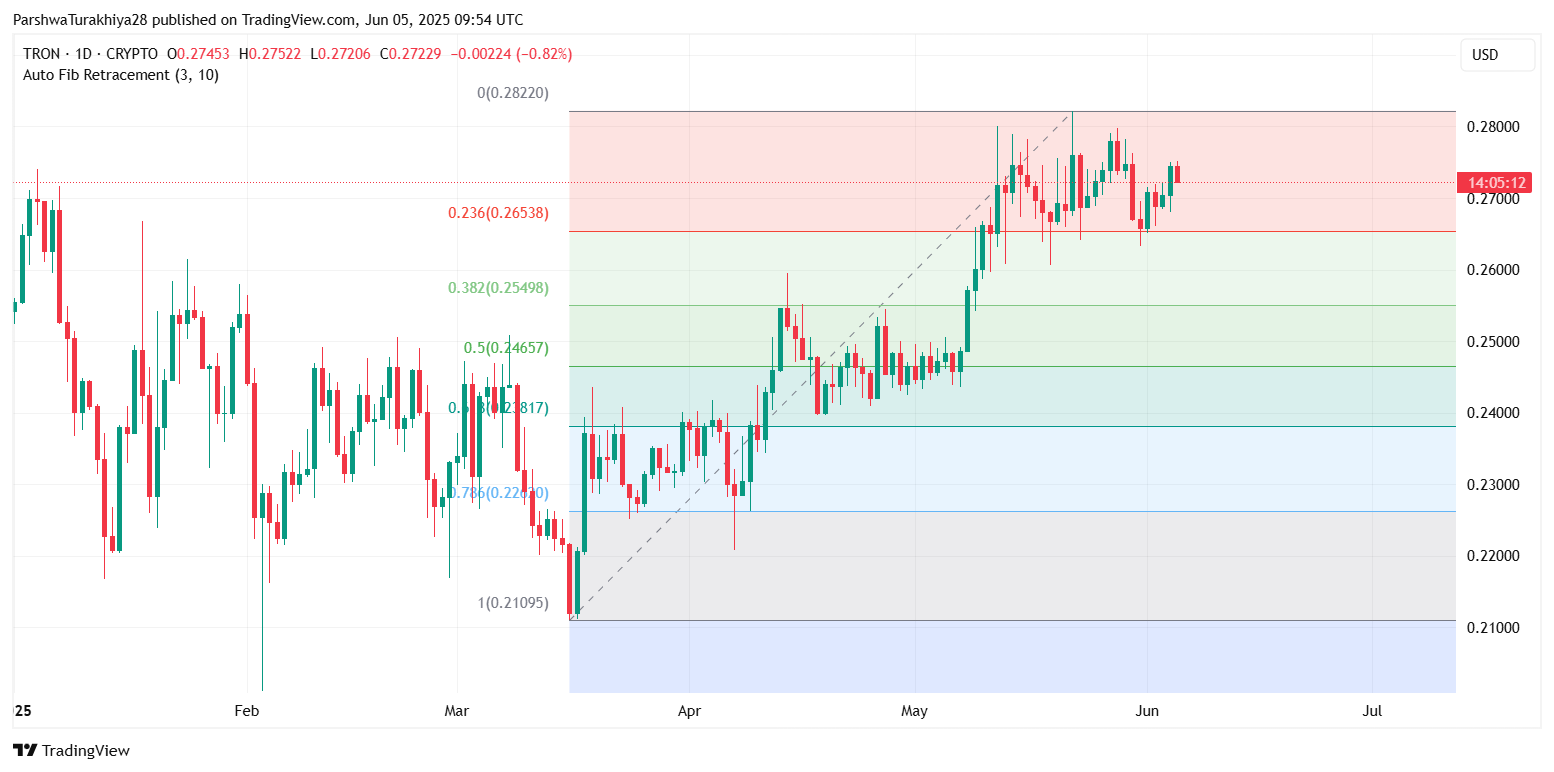
On the daily chart, TRON price remains pinned beneath the recent local high near $0.2822, which marks the 0% Fibonacci extension from its March–April rally. Price action has formed a tight horizontal band between $0.2650 and $0.2820, with multiple daily wicks reflecting rejection from the upper bound. Importantly, the asset is still maintaining higher lows since April, indicating underlying bullish structure despite consolidation.
Support is holding firm at the 0.236 Fib level ($0.2653), while the 0.382 level near $0.2549 continues to underpin broader trend support. The TRON price update shows that although price has lost some momentum, no major breakdown has occurred yet.
Short-Term Indicators Show Caution Into June 6
 TRX price dynamics (Source: TradingView)
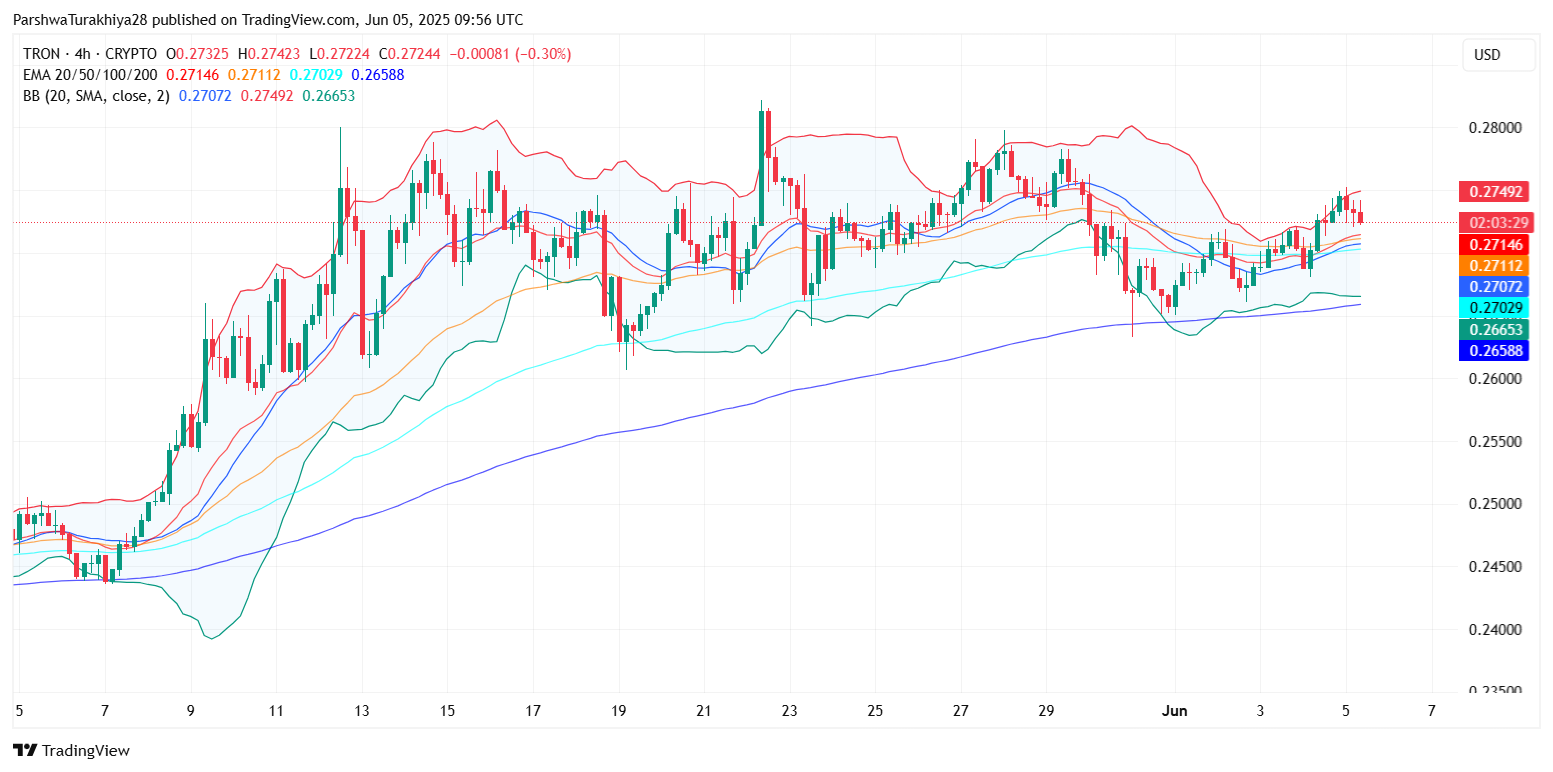
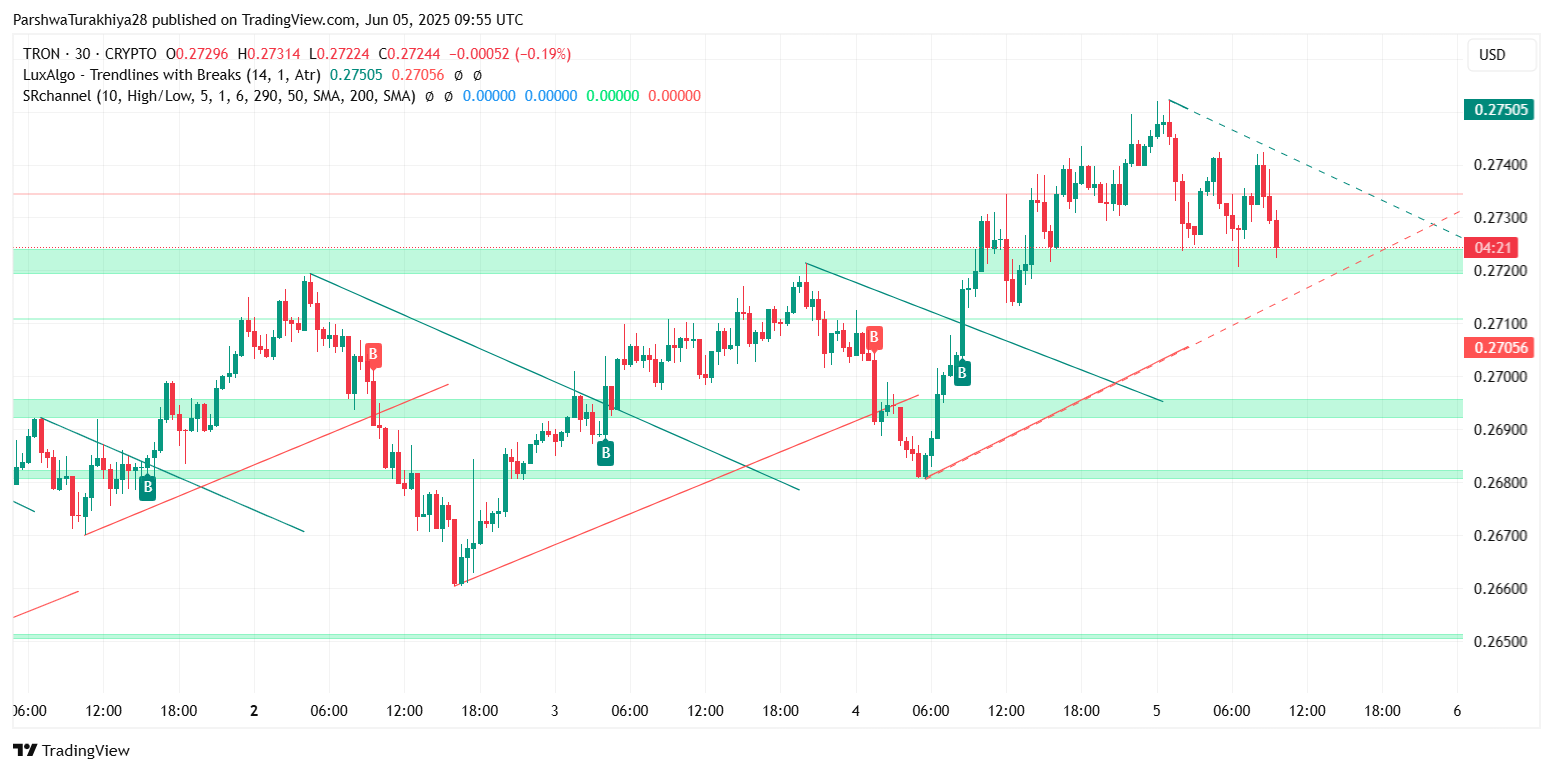
On the 4-hour timeframe, the price is hovering just below a descending trendline near $0.2750, with visible rejection shadows showing fading bullish strength. However, the EMA cluster (20/50/100/200) between $0.2702 and $0.2714 is offering near-term support. This compression of moving averages signals a potential volatility expansion phase.
Bollinger Bands are tightening, while the upper band at $0.2749 aligns closely with immediate resistance. A clear breakout above this level could lead to TRON price spikes toward $0.2820 and possibly higher. But a failure to hold above $0.2700 may open a retest of the $0.2660 and $0.2620 support zones.
Mixed RSI and MACD Readings Signal Neutral Bias
 TRX price dynamics (Source: TradingView)
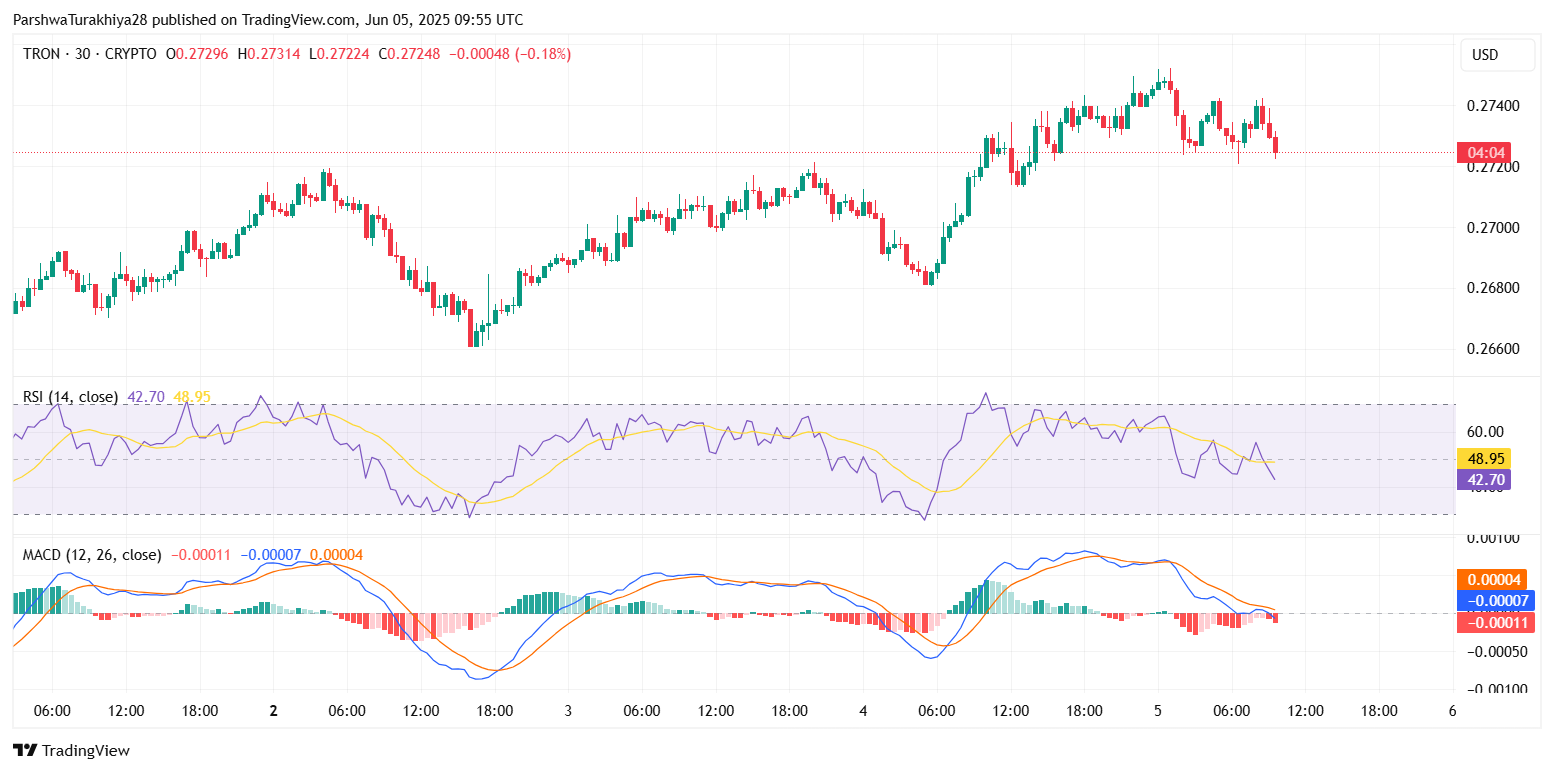
On the 30-minute chart, RSI is trending near 42.70—tilting bearish but not yet oversold—while the MACD is showing minor bearish crossover signals, suggesting weakening momentum. These short-term signals reinforce the need for caution, as the current TRON price volatility is not yet pointing toward a clear directional trend.
Stoch RSI readings are beginning to rise from the lower quadrant, but not strongly enough to confirm bullish divergence. This reinforces the neutral-to-bearish sentiment in lower timeframes, especially if price remains capped beneath $0.2750.
Ichimoku Cloud Holding Price in Balance
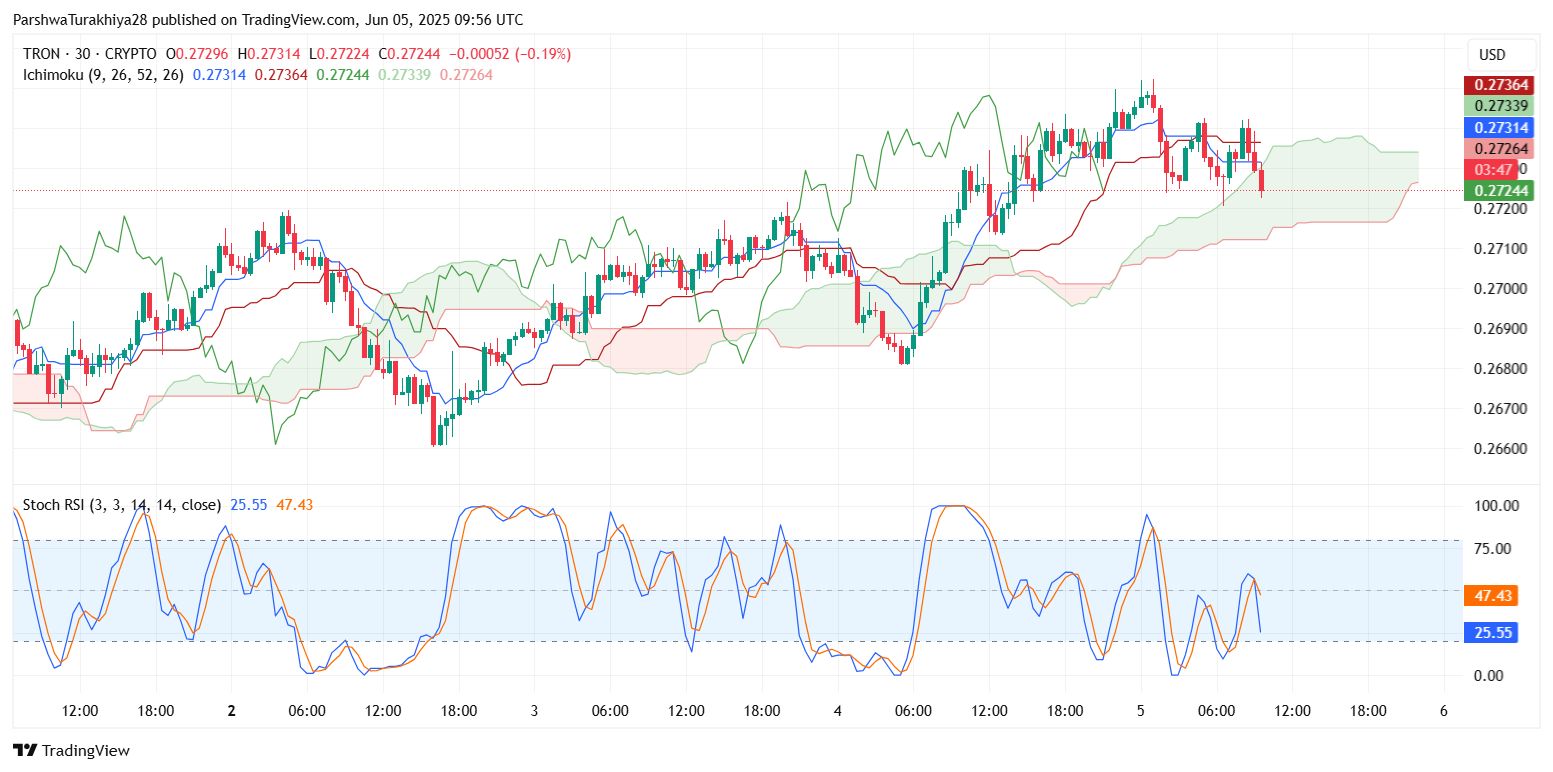 TRX price dynamics (Source: TradingView)
The Ichimoku Cloud on the 30-minute chart offers additional confirmation of a market in flux. Price is sitting on the top of the Kumo cloud, with the Tenkan-Sen and Kijun-Sen converging tightly near $0.2731. A breakdown below this cloud could invite fresh selling, while a bounce from current levels may catalyze another upward attempt.
Until there is a decisive candle close above the trendline resistance or below the Kumo base, traders should prepare for choppy TRON price action.
TRX Short-Term Forecast and Key Levels
 TRX price dynamics (Source: TradingView)
As of June 5, TRX remains in a contraction phase, with pressure building for a breakout. A sustained move above $0.2750 may confirm bullish continuation toward $0.2820 and possibly $0.2900. On the flip side, a drop below $0.2660 would invalidate the current higher-low structure and expose $0.2540–$0.2460 zones.
| Technical Indicator | Signal/Level |
| Current Price | $0.2724 |
| Immediate Resistance | $0.2750 |
| Major Resistance | $0.2820 |
| Immediate Support | $0.2665 |
| Strong Support | $0.2549 (Fib 0.382) |
| RSI (30-min) | 42.70 (Neutral-bearish) |
| MACD (30-min) | Bearish crossover |
| Ichimoku Support | $0.2724 (cloud base) |
| EMA Cluster Support | $0.2702–$0.2714 |
The current TRON price remains within a compression phase, and TRON price today is slightly weaker but still range-bound. Traders should keep a close eye on breakout confirmation above $0.2750 or a rejection below $0.2660 to determine why TRON price is going down or up today in the next 24 hours.
Disclaimer: The information presented in this article is for informational and educational purposes only. The article does not constitute financial advice or advice of any kind. Coin Edition is not responsible for any losses incurred as a result of the utilization of content, products, or services mentioned. Readers are advised to exercise caution before taking any action related to the company.