Date: Sun, June 08, 2025 | 09:10 AM GMT
The cryptocurrency market is bouncing back strongly after Thursday’s sharp sell-off, which briefly dragged Bitcoin (BTC) to a low of $100,430 and Ethereum (ETH) to $2,387. However, the tide has turned—BTC has reclaimed levels above $105,500, while ETH has recovered to around $2,515. This broader rebound is now lifting sentiment across altcoins , including Stellar (XLM).
XLM is back on the green track and a closer analysis of the chart reveals that the asset may be preparing for a stronger continuation to the upside.
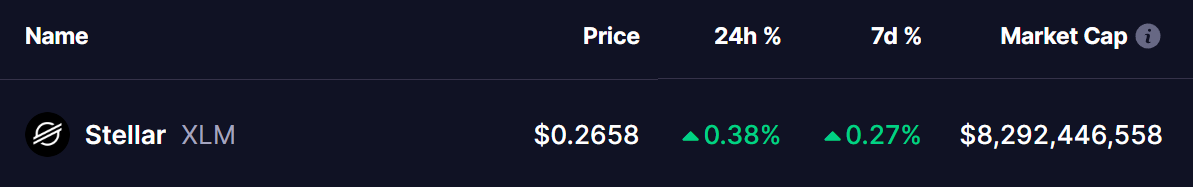 Source: Coinmarketcap
Technical Patterns Hint at Upside Momentum
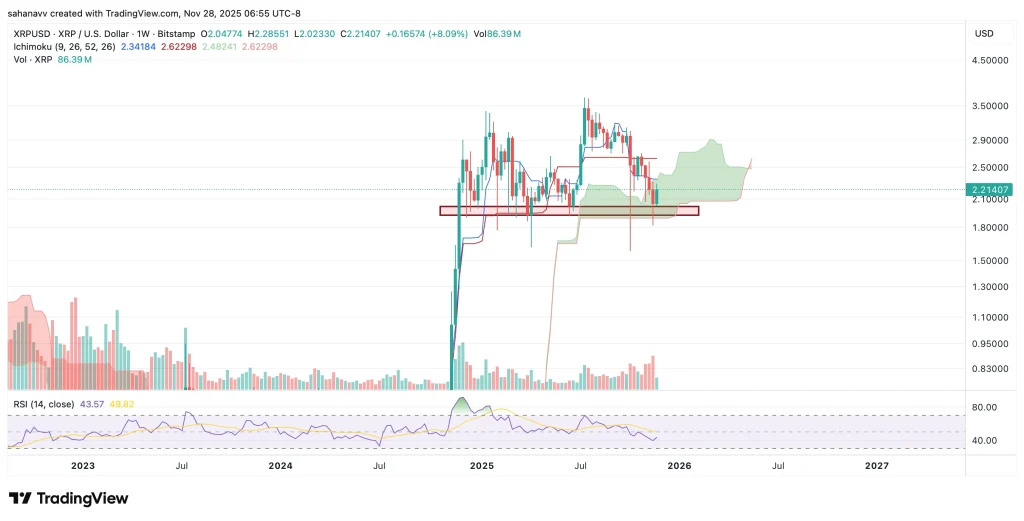
The 4-hour chart for XLM shows a breakout from a falling wedge formation—a bullish pattern that often precedes trend reversals. Adding further weight to the bullish case is the formation of a Bearish Cypher harmonic pattern, a setup that typically signals a short-term rally before entering a potential reversal zone.
The structure began with a top at $0.3123 (point X), followed by a decline to $0.2589 (point A). XLM then retraced to $0.2762 (point B), before dipping again to $0.2525 (point C). This recent recovery from point C marks the beginning of the final leg toward point D.
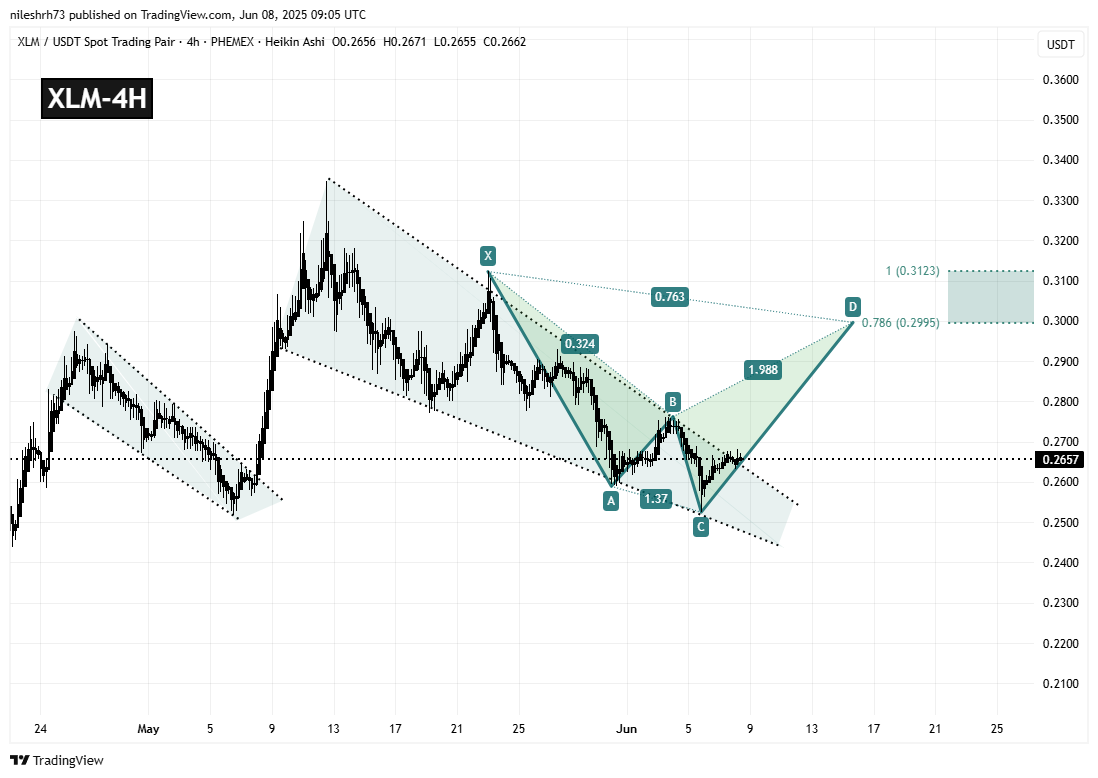 Stellar (XLM) 4H Chart/Coinsprobe (Source: Tradingview)
The projected D leg lies between $0.2995 and $0.3123, aligning with the 78.6% Fibonacci retracement of the XC leg and the 100% Fibonacci extension. These levels serve as potential resistance and completion zones for the harmonic pattern. From its current price near $0.2657, a move to the D-zone implies a potential upside of 12% to 17%.
What’s Next for XLM?
A confirmed breakout from the falling wedge, combined with a well-respected harmonic structure, points to the possibility of XLM continuing its recovery run. If buyers manage to lift prices into the $0.2995 to $0.3123 range, it would validate the harmonic setup. However, traders should be aware that this zone could also invite profit-taking and short-term selling pressure, as is often seen near harmonic completion levels.
Disclaimer: This article is for informational purposes only and not financial advice. Always conduct your own research before investing in cryptocurrencies.