
PEPE Set to Explode? Chart Says Yes!

PEPE price is showing signs of a breakout both on the hourly and daily charts. After consolidating near key support zones, the memecoin is now attempting to reclaim lost ground. The daily chart indicates a fresh bounce from the 100-day SMA, while the hourly chart displays a clear bullish structure forming higher lows and higher highs. Momentum is building—and it may only be a matter of time before PEPE coin price tests higher Fibonacci levels .
Pepe Price Prediction: Breakout Structure Is Forming
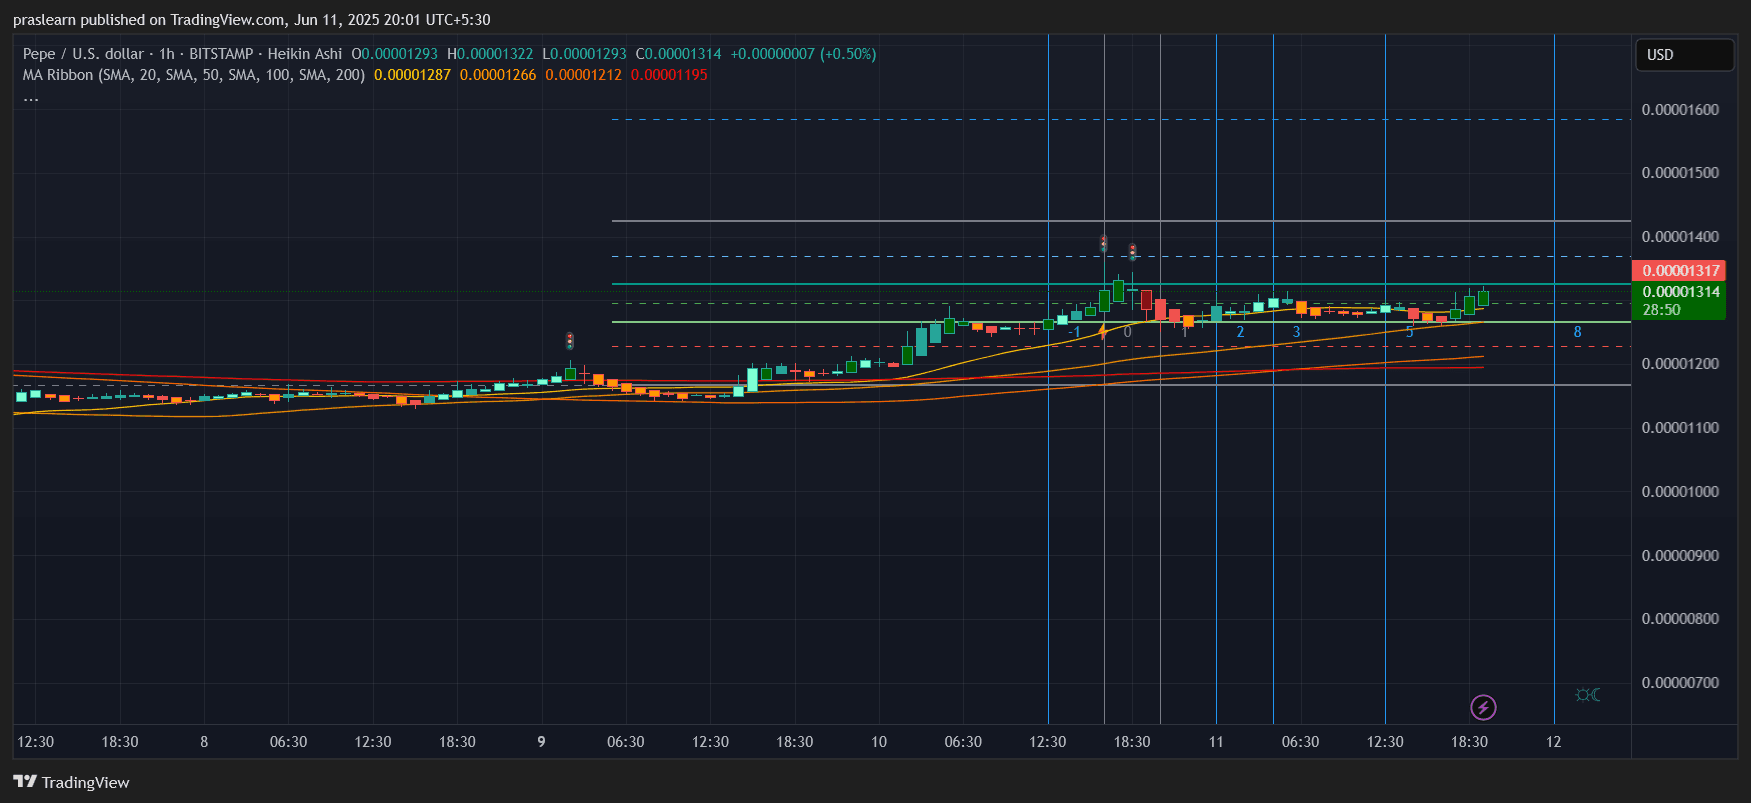 PEPE/USD 1 Hr Chart: TradingView
The hourly chart shows PEPE price trading at $0.00001314 , with the price steadily climbing above the SMA 20/50/100 cluster, currently around $0.00001266–0.00001287. The 200 SMA sits further below at $0.00001195, reinforcing the support base.
We also see a 5-wave Elliott structure completing, with Wave 5 forming higher than Wave 3, indicating impulsive buying. PEPE has crossed the $0.00001300 resistance and is targeting the $0.00001360–$0.00001400 zone.
The Fibonacci extension shows the 1.618 level at approximately $0.00001428, a potential short-term target. If momentum continues, we could see a move toward the $0.00001550 level, which is the 2.618 extension. This gives traders a quick upside of nearly 18% from current levels.
Calculation:
If PEPE price breaks $0.00001360 and hits $0.00001550:
Gain = (0.00001550 - 0.00001314) / 0.00001314 × 100 = 17.94%
📊 Buy PEPE on Bitget
Daily Chart: Strong Reversal Signal?
 PEPE/USD Daily Chart: TradingView
On the daily chart, PEPE price bounced from the 50-day SMA (~$0.00001160) after completing a retracement from its May high. Today’s green candle confirms bullish pressure, reclaiming the short-term downtrend resistance line.
A golden cross remains active from early May when the 50-day SMA crossed above the 200-day SMA, a long-term bullish signal. Currently, the 200-day SMA is at $0.00000937, which PEPE is comfortably holding above.
The Fibonacci retracement from the recent swing high to swing low shows price recovering above the 38.2% level, with targets near the $0.00001600 mark. If the daily close confirms above $0.00001317, it would invalidate the recent bearish trend and open the gates to a potential 20% rally.
Upside Potential Calculation:
From current price $0.00001303 to Fibonacci resistance at $0.00001600:
(0.00001600 - 0.00001303) / 0.00001303 × 100 = 22.75%
📊 Buy PEPE on Bitget
Pepe Price Prediction: Is PEPE Coin Price Ready to Rally This Week?
Yes, technically the signs are all there. We have:
- A clean bounce from long-term support
- A bullish engulfing candle forming on the daily
- The hourly chart shows trend continuation above key moving averages
- Fibonacci extensions and retracements point toward a $0.00001400–$0.00001600 move
Volume is gradually picking up, and with no major resistance until $0.00001600, the risk-reward ratio is favorable for bullish traders.
Final Take: Can PEPE Price Hit $0.00001600 in June?
If the momentum sustains and Bitcoin remains stable, PEPE coin price can easily test $0.00001600 within the next 7–10 days . That would mark a +22% move from current levels. Watch for a decisive daily close above $0.00001320, which would signal the start of a new bullish wave. PEPE isn’t just memeing anymore—it’s gearing up for a serious breakout.
$PEPE, $Pepe
PEPE price is showing signs of a breakout both on the hourly and daily charts. After consolidating near key support zones, the memecoin is now attempting to reclaim lost ground. The daily chart indicates a fresh bounce from the 100-day SMA, while the hourly chart displays a clear bullish structure forming higher lows and higher highs. Momentum is building—and it may only be a matter of time before PEPE coin price tests higher Fibonacci levels .
Pepe Price Prediction: Breakout Structure Is Forming
PEPE/USD 1 Hr Chart: TradingView
The hourly chart shows PEPE price trading at $0.00001314 , with the price steadily climbing above the SMA 20/50/100 cluster, currently around $0.00001266–0.00001287. The 200 SMA sits further below at $0.00001195, reinforcing the support base.
We also see a 5-wave Elliott structure completing, with Wave 5 forming higher than Wave 3, indicating impulsive buying. PEPE has crossed the $0.00001300 resistance and is targeting the $0.00001360–$0.00001400 zone.
The Fibonacci extension shows the 1.618 level at approximately $0.00001428, a potential short-term target. If momentum continues, we could see a move toward the $0.00001550 level, which is the 2.618 extension. This gives traders a quick upside of nearly 18% from current levels.
Calculation:
If PEPE price breaks $0.00001360 and hits $0.00001550:
Gain = (0.00001550 - 0.00001314) / 0.00001314 × 100 = 17.94%
📊 Buy PEPE on Bitget
Daily Chart: Strong Reversal Signal?
PEPE/USD Daily Chart: TradingView
On the daily chart, PEPE price bounced from the 50-day SMA (~$0.00001160) after completing a retracement from its May high. Today’s green candle confirms bullish pressure, reclaiming the short-term downtrend resistance line.
A golden cross remains active from early May when the 50-day SMA crossed above the 200-day SMA, a long-term bullish signal. Currently, the 200-day SMA is at $0.00000937, which PEPE is comfortably holding above.
The Fibonacci retracement from the recent swing high to swing low shows price recovering above the 38.2% level, with targets near the $0.00001600 mark. If the daily close confirms above $0.00001317, it would invalidate the recent bearish trend and open the gates to a potential 20% rally.
Upside Potential Calculation:
From current price $0.00001303 to Fibonacci resistance at $0.00001600:
(0.00001600 - 0.00001303) / 0.00001303 × 100 = 22.75%
📊 Buy PEPE on Bitget
Pepe Price Prediction: Is PEPE Coin Price Ready to Rally This Week?
Yes, technically the signs are all there. We have:
- A clean bounce from long-term support
- A bullish engulfing candle forming on the daily
- The hourly chart shows trend continuation above key moving averages
- Fibonacci extensions and retracements point toward a $0.00001400–$0.00001600 move
Volume is gradually picking up, and with no major resistance until $0.00001600, the risk-reward ratio is favorable for bullish traders.
Final Take: Can PEPE Price Hit $0.00001600 in June?
If the momentum sustains and Bitcoin remains stable, PEPE coin price can easily test $0.00001600 within the next 7–10 days . That would mark a +22% move from current levels. Watch for a decisive daily close above $0.00001320, which would signal the start of a new bullish wave. PEPE isn’t just memeing anymore—it’s gearing up for a serious breakout.
$PEPE, $Pepe
Disclaimer: The content of this article solely reflects the author's opinion and does not represent the platform in any capacity. This article is not intended to serve as a reference for making investment decisions.
You may also like
Bitget donates HK$12 million to support fire rescue and reconstruction efforts in Tai Po, Hong Kong
Bitget Spot Margin Announcement on Suspension of ELX/USDT Margin Trading Services
Enjoy perks for new grid traders and receive dual rewards totaling 150 USDT
Bitget Spot Margin Announcement on Suspension of BEAM/USDT, ZEREBRO/USDT, AVAIL/USDT, HIPPO/USDT, ORBS/USDT Margin Trading Services