
- Fartcoin is trading in a tight $0.95-$1.66 range after a massive 700% rally earlier this year.
- The memecoin maintains strong support at the $1.00 psychological level and $0.80 EMA.
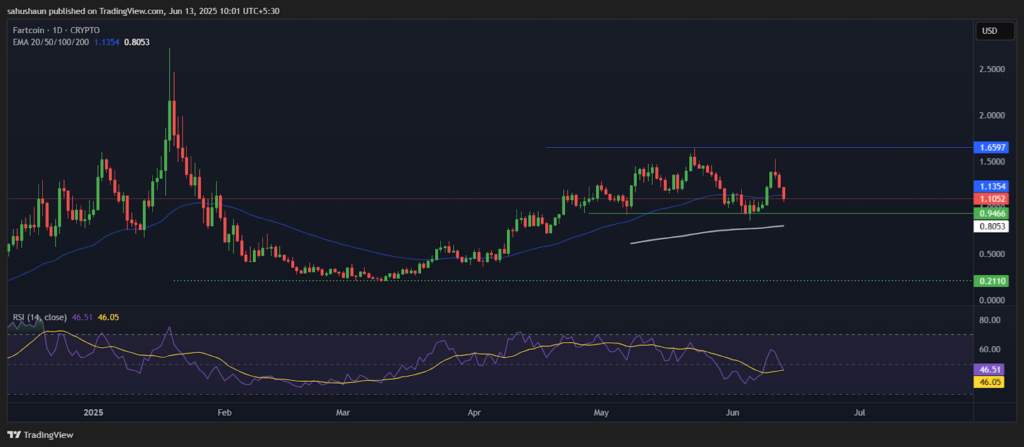
Fartcoin is consolidating within a tight range following considerable volatility in the coin during the first half of the year. After a 700% bullish rally, this Solana-based memecoin is trading within a $0.9466 to $1.66 range.
The daily technical chart shows the distinct recovery trend since February lows of about $0.21, and the memecoin has developed a strong rising trend. During the bullish trend, Fartcoin reached a high of about $1.65 in the last week of April and the first week of May.
After touching the high, FARTCOIN has been consolidating between the support of $1.00 and the resistance of $1.66. This lateral action implies that the market is absorbing the prior gains as it accumulates momentum for the next directional move.
Moving average analysis depicts that the price is trading below the important exponential moving averages, and this suggests that there is a short-term bearish momentum. Nevertheless, the entire trend framework is still in place, as new highs are formed during the consolidation.
The fact that there are several touch points at the $1.00 support level indicates that there is a lot of buying interest at these levels, and therefore, it is possible that institutions could be accumulating.
According to CoinMarketCap data, presently, Fartcoin is trading at the price of $1.111 with an intraday drawdown of 20%, suggesting bearishness. Despite the bearish trend, the trading volume has increased by 25%, suggesting bulls are still active in this memecoin.
What’s Next for Fartcoin Price?
 Source: Tradingview
The Fartcoin RSI indicator at 46.05 shows neutral momentum, not oversold or overbought. This is a flexible positioning to move either way, but the recent pullback off the overbought territory indicates that some of the selling pressure has been taken in. The current value of the RSI means that the memecoin can extend in an upward direction further before facing resistance based on momentum.
The MACD analysis indicates a bullish crossover. However, the MACD and signal curve are still below the zero line, which confirms the weakening momentum of the current consolidation phase. The histogram is still green, indicating decreasing negative momentum, and so the selling pressure could be drying up. The Awesome Oscillator confirms this opinion, as it displays neutral signs yet recent green bars, which may signal a shift of momentum.
Right now, Fartcoin is in a strong position as there are multiple supports below it. The memecoin has solid psychological support of $1.00 and a 200-day EMA support at $0.8053. However, a downward break of $1.00 may lead to extended losses towards $0.50, whereas a convincing break over $1.66 resistance may aim for the psychological $2.00.
The present price movement indicates that FARTCOIN has reached a crossroads. The upcoming couple of trading sessions will probably decide the medium-term trend of this highly volatile crypto asset.
Highlighted Crypto News Today:
Coinbase to Roll Out CFTC-Compliant Perpetual Futures in the U.S.