
How High Can PI Price Go This Month?

Pi Network’s price is heating up again after a long downtrend. But is this a real breakout or just another fake pump? Let’s dive into the charts and see where PI price could be heading next.
PI Price Prediction: What Does the Daily Chart Reveal?
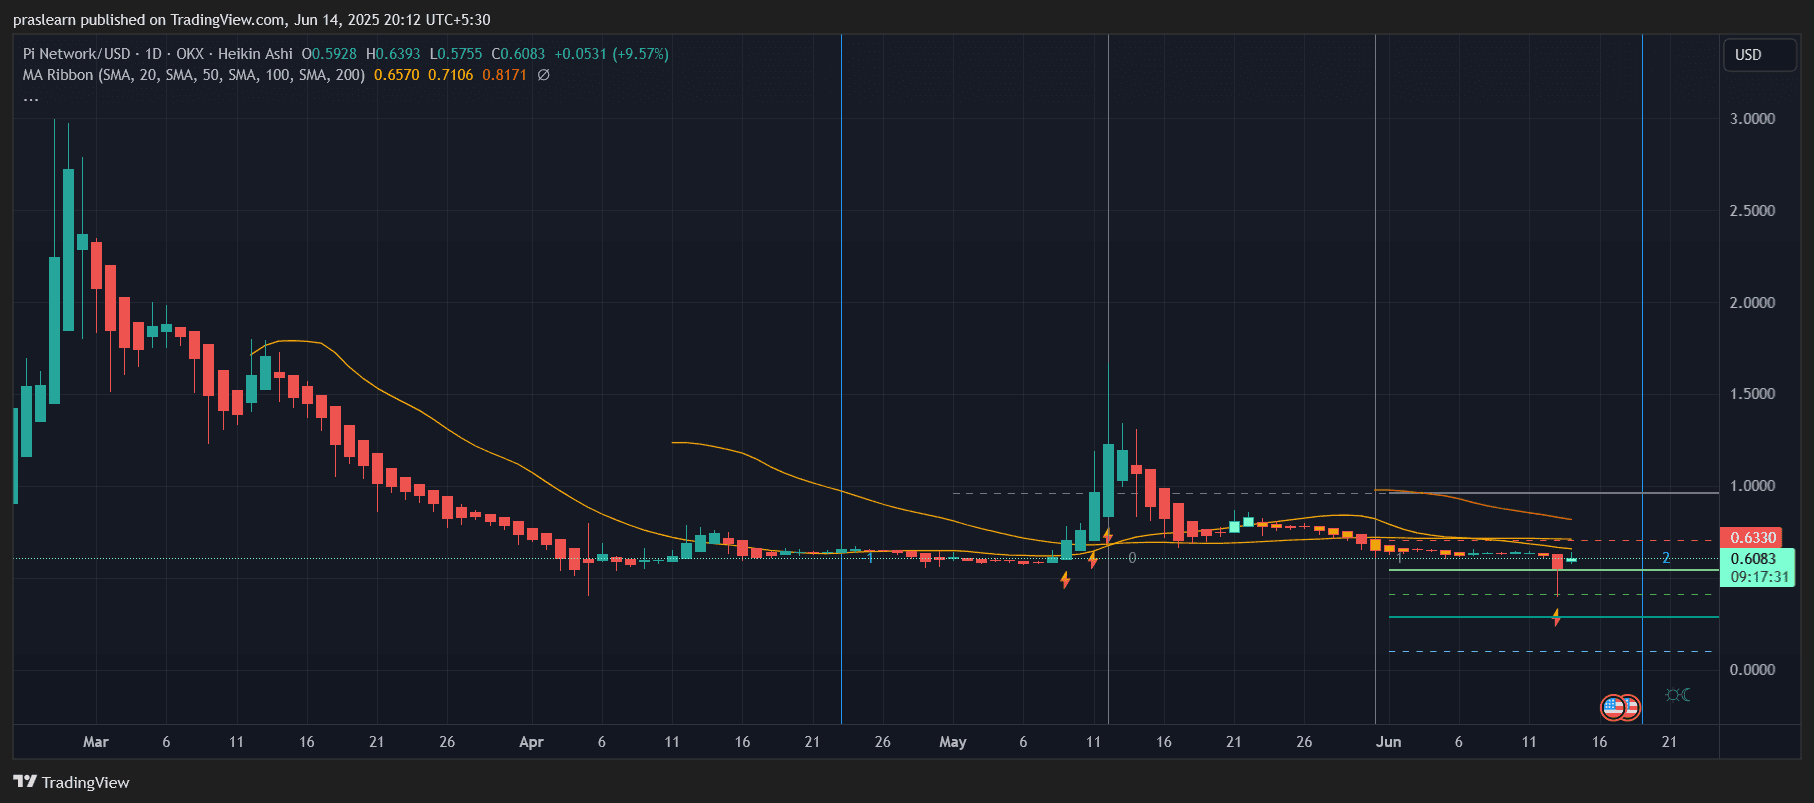 PI/USD 1 Day Chart- TradingView
Looking at the daily chart, PI price is currently priced around $0.6083 , registering a strong +9.57% daily gain. This comes after an extended decline from its local high of nearly $3.5 back in early 2025. The recent bullish candle is significant—it has broken above the short-term resistance of $0.575, closing above it for the first time in weeks.
The 20-day and 50-day moving averages, however, are still acting as overhead resistance, with the 50-SMA at $0.657 and 100-SMA at $0.7106. This gives us the next potential resistance zone around $0.65 to $0.71. If PI price manages to sustain momentum and flip these levels into support, we could realistically see a push toward $1, which is also a key psychological barrier and aligns with the historical resistance zone in May.
A quick Fibonacci retracement from the swing high of $3.50 to the swing low near $0.50 shows the 0.236 level sits around $1.19, which could act as a longer-term upside target if the bulls truly take control.
What’s Happening on the Hourly Chart?
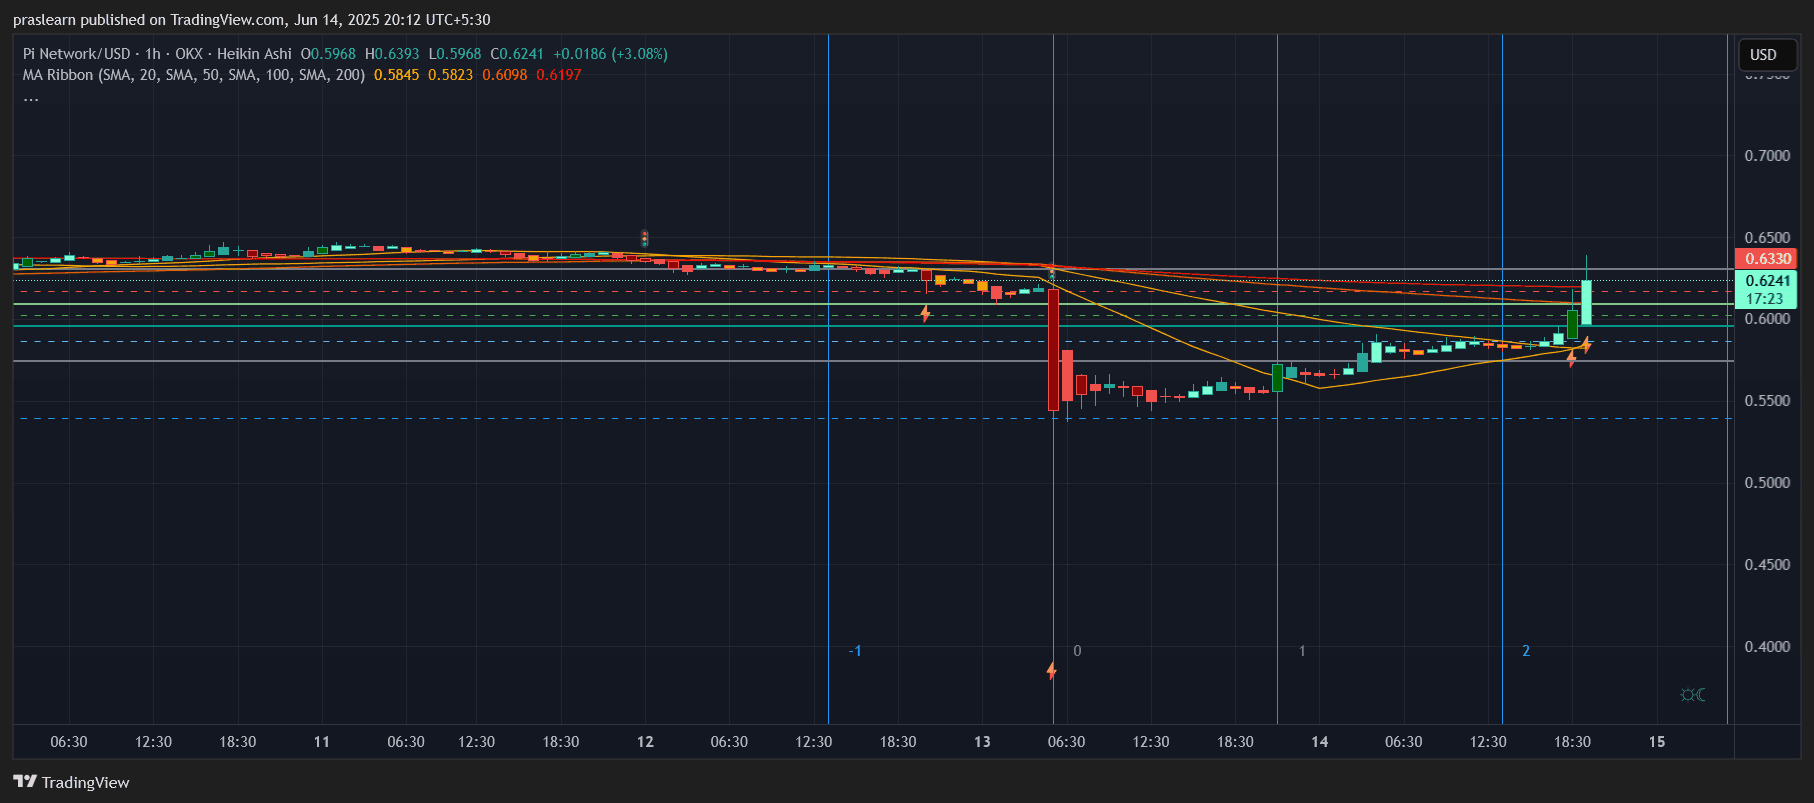 PI/USD 1 Hr Chart- TradingView
The hourly chart paints a different but supportive story. After days of consolidation and a sharp flash crash below $0.52, the PI price quickly rebounded and formed a bullish structure with higher lows and a clean breakout above the 100-hour SMA. At the time of writing, PI is trading at $0.6241, up 3.08% intraday.
A golden cross recently formed on this lower timeframe, where the 50-SMA crossed above the 100-SMA, indicating the beginning of short-term bullish momentum. What’s even more notable is the explosive breakout candle that surged past $0.60, breaking through the dense resistance cluster between $0.582 – $0.6098.
This clean break above multiple moving averages and resistance levels signals that PI might retest the upper resistance around $0.633, which it momentarily touched during the recent candle wick. A close above this zone could lead to a sharp rally toward $0.70, backed by the thin volume profile in that range.
Can PI Price Really Hit $1 Again?
Let’s do the math. If PI price continues its bullish momentum and closes above $0.65 on both the hourly and daily timeframes, it opens the path to $1. Here's a simple projection:
- Current Price: $0.62
- Immediate Resistance: $0.633
- Short-term Target: $0.70
- Mid-term Target: $1.00
If PI price can gain another 60% from the current price ($0.62 × 1.6), it reaches $0.992, just shy of the $1 mark. This is entirely possible if trading volume increases and broader market conditions support altcoin rallies.
Moreover, PI has a history of fast rallies, as seen during its spike from $0.50 to over $3. This proves that once momentum kicks in, the coin can move parabolically. A clean break above $0.71 and reclaim of $1 could bring the next wave of buyers targeting the $1.20–$1.50 Fibonacci extension range.
What Are the Risks?
While the charts look bullish, it's crucial to note that PI is still trading below all major daily moving averages. The 100-SMA and 200-SMA are sloping down, which means the macro trend is still bearish until proven otherwise. If bulls fail to hold above $0.60, a drop back toward $0.55 or even the recent low of $0.50 could play out.
Pi Price Prediction: How High Can PI Go in June?
If current momentum sustains and PI price closes above $0.65 on the daily chart, a push toward $0.90–$1.00 is likely within this month. If bulls manage to break that psychological barrier, the move could extend toward $1.20–$1.50. But for now, the bulls must protect the $0.60–$0.63 support band at all costs.
Pi Network is showing signs of life again. The charts suggest a bullish breakout is underway, but key resistance zones need to be cleared. If it holds above $0.60 and breaks past $0.71, PI could revisit the $1 mark sooner than many expect. Let’s see if Pi has what it takes to circle back into the spotlight.
$PI
Pi Network’s price is heating up again after a long downtrend. But is this a real breakout or just another fake pump? Let’s dive into the charts and see where PI price could be heading next.
PI Price Prediction: What Does the Daily Chart Reveal?
PI/USD 1 Day Chart- TradingView
Looking at the daily chart, PI price is currently priced around $0.6083 , registering a strong +9.57% daily gain. This comes after an extended decline from its local high of nearly $3.5 back in early 2025. The recent bullish candle is significant—it has broken above the short-term resistance of $0.575, closing above it for the first time in weeks.
The 20-day and 50-day moving averages, however, are still acting as overhead resistance, with the 50-SMA at $0.657 and 100-SMA at $0.7106. This gives us the next potential resistance zone around $0.65 to $0.71. If PI price manages to sustain momentum and flip these levels into support, we could realistically see a push toward $1, which is also a key psychological barrier and aligns with the historical resistance zone in May.
A quick Fibonacci retracement from the swing high of $3.50 to the swing low near $0.50 shows the 0.236 level sits around $1.19, which could act as a longer-term upside target if the bulls truly take control.
What’s Happening on the Hourly Chart?
PI/USD 1 Hr Chart- TradingView
The hourly chart paints a different but supportive story. After days of consolidation and a sharp flash crash below $0.52, the PI price quickly rebounded and formed a bullish structure with higher lows and a clean breakout above the 100-hour SMA. At the time of writing, PI is trading at $0.6241, up 3.08% intraday.
A golden cross recently formed on this lower timeframe, where the 50-SMA crossed above the 100-SMA, indicating the beginning of short-term bullish momentum. What’s even more notable is the explosive breakout candle that surged past $0.60, breaking through the dense resistance cluster between $0.582 – $0.6098.
This clean break above multiple moving averages and resistance levels signals that PI might retest the upper resistance around $0.633, which it momentarily touched during the recent candle wick. A close above this zone could lead to a sharp rally toward $0.70, backed by the thin volume profile in that range.
Can PI Price Really Hit $1 Again?
Let’s do the math. If PI price continues its bullish momentum and closes above $0.65 on both the hourly and daily timeframes, it opens the path to $1. Here's a simple projection:
- Current Price: $0.62
- Immediate Resistance: $0.633
- Short-term Target: $0.70
- Mid-term Target: $1.00
If PI price can gain another 60% from the current price ($0.62 × 1.6), it reaches $0.992, just shy of the $1 mark. This is entirely possible if trading volume increases and broader market conditions support altcoin rallies.
Moreover, PI has a history of fast rallies, as seen during its spike from $0.50 to over $3. This proves that once momentum kicks in, the coin can move parabolically. A clean break above $0.71 and reclaim of $1 could bring the next wave of buyers targeting the $1.20–$1.50 Fibonacci extension range.
What Are the Risks?
While the charts look bullish, it's crucial to note that PI is still trading below all major daily moving averages. The 100-SMA and 200-SMA are sloping down, which means the macro trend is still bearish until proven otherwise. If bulls fail to hold above $0.60, a drop back toward $0.55 or even the recent low of $0.50 could play out.
Pi Price Prediction: How High Can PI Go in June?
If current momentum sustains and PI price closes above $0.65 on the daily chart, a push toward $0.90–$1.00 is likely within this month. If bulls manage to break that psychological barrier, the move could extend toward $1.20–$1.50. But for now, the bulls must protect the $0.60–$0.63 support band at all costs.
Pi Network is showing signs of life again. The charts suggest a bullish breakout is underway, but key resistance zones need to be cleared. If it holds above $0.60 and breaks past $0.71, PI could revisit the $1 mark sooner than many expect. Let’s see if Pi has what it takes to circle back into the spotlight.
$PI
Disclaimer: The content of this article solely reflects the author's opinion and does not represent the platform in any capacity. This article is not intended to serve as a reference for making investment decisions.
You may also like
Bitget adjusts the maximum leverage for spot cross margin trading to 5x
Bitget adjusts the maximum leverage for spot cross margin trading to 5x
Bitget adjusts the collateral ratios for cross spot margin trading pairs
MONUSDT now launched for futures trading and trading bots