Solana highlights 3,200 active devs, $1b+ app revenue for second straight quarter
Solana’s network continues to attract strong engagement, with more than $1 billion in app revenue.
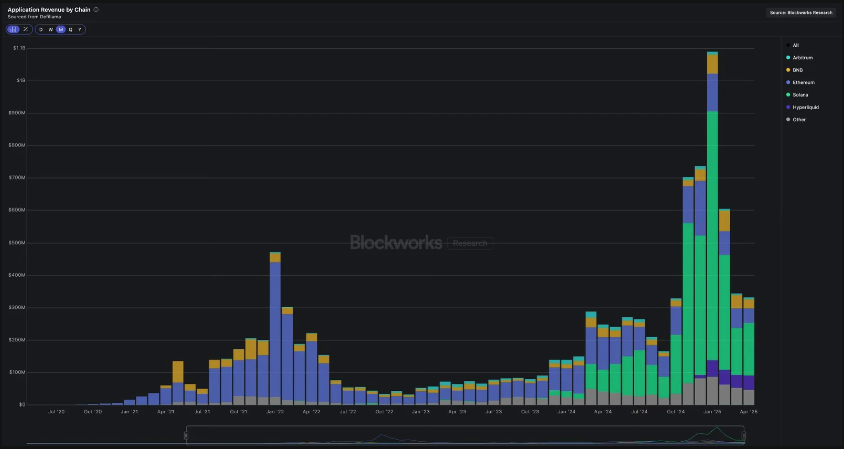
Solana (SOL) continues to see strong user engagement. On Friday, the Solana Foundation published its Solana Network Health Report , showcasing its performance in Q2 of 2025. Notably, the app revenue on the network exceeded $1 billion for the second quarter in a row.
 Application revenue by chain | Source: Solana Foundation
In Q2, Solana’s app revenue rose compared to Q1—even as application revenue on other major networks declined. In fact, Solana’s app revenue now surpasses the combined total of all other blockchain networks.
This activity also contributed to a sharp rise in validator income, which reached an average quarterly level of $800 million. The peak occurred on Jan. 19, with $56.9 million earned in a single day. At the same time, validator costs have dropped dramatically.
Notably, the breakeven SOL stake required for validators to cover their costs has fallen significantly. Validators now require just 16,000 SOL to break even, down from 50,000 SOL in 2022. According to the Solana Foundation, this reflects substantial improvements in network efficiency.
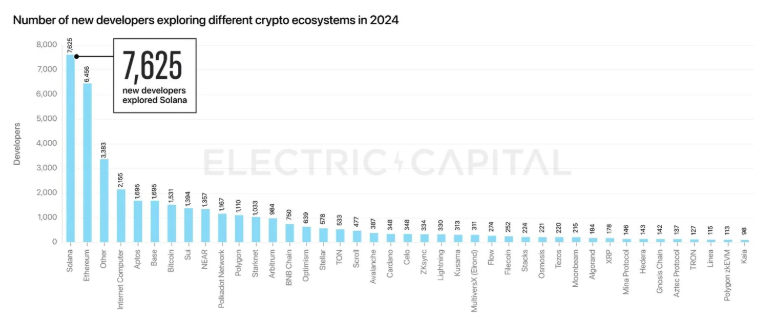
Solana has also topped the charts in attracting new developers. In 2024, the network drew 7,625 developers, more than any other blockchain, including Ethereum.
 Number of new developers exploring different crypto ecosystems | Source: Electric Capital report
Solana Foundation showcases decentralization gains
According to the Solana Foundation, the network has made significant gains in decentralization. The Nakamoto Coefficient, used to measure how decentralized a network is, reached 20 by June. This puts Solana ahead of Ethereum, Sui, and Sei, which have coefficients of 6, 18, and 7, respectively.
Solana validators are also geographically distributed, with no single country or data center controlling more than 33% of the total stake. Germany leads with 23.55%, followed by the U.S. at 17.37%, and the Netherlands at 14.36%.
Disclaimer: The content of this article solely reflects the author's opinion and does not represent the platform in any capacity. This article is not intended to serve as a reference for making investment decisions.
You may also like
GBP/USD dips to 1.3370 as robust US figures boost Dollar strength
Verizon Provides $20 Compensation to Users Impacted by Service Disruption
Trump Media ETFs Put Brand Strength to the Test in a Competitive $14 Trillion Industry
Cardano Price Prediction: ADA Quietly Surges After Inflation Drop – Is This the Breakout No One Sees Coming?

