USDC Supply and Circle Valuation: Is the $58 Billion Market Cap a Bubble or Undervalued?
 2025/06/27 08:00
Original Article Title: The Full Circle: How USDC Supply Curve Shapes its Valuation
Original Source: Alkimiya
Original Translation: Deep Tide TechFlow
“An accurate estimate of intrinsic value is the foundation of stable, rational, and potentially profitable investing.”
—Howard Marks
Introduction
The milestone listing of Circle on the public market highlights institutional demand for regulated crypto infrastructure. However, the sustainability of its valuation depends on the expansion of its core revenue engine, which is closely tied to the total supply of USDC.
This article aims to shift from narrative to data measurement. Over 95% of Circle's revenue comes from USDC-related channels, making it highly sensitive to short-term rates and the total circulation of USDC. We first structurally decompose the supply curve of USDC, analyze changes in chain-level concentration, relative capital liquidity, and inflection points in specific market environments to identify the variables most driving minting activity.
Next, we introduce a recalibrated autoregressive model that can predict weekly supply with an error range of approximately ±1.5% and directly convert incremental expansion into EBITDA (Earnings Before Interest, Taxes, Depreciation, and Amortization) sensitivity.
Finally, as a conclusion, we demonstrate how this supply metric can be used as a real-time tradable signal, providing market participants with a real-time proxy for Circle's fundamental dynamics.
Circle Valuation Structure Analysis
Based on a market capitalization of $582 billion, Circle's Price/Earnings (P/E) ratio has exceeded nearly 8 times that of Visa (Visa's P/E ratio is around 15 times). Strong investments from high-profile institutions like ARK Invest and BlackRock indicate that investors are not only pricing in the current fundamentals but also betting on its potential for widespread adoption in the future.
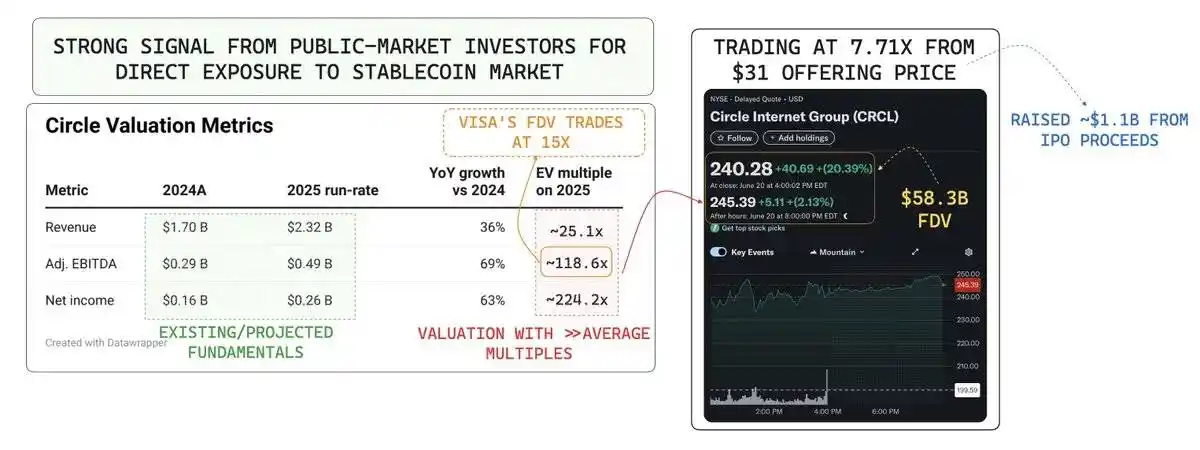
Circle's Valuation Metrics Stock Ticker Screen - Data Source: Yahoo Finance
In order to maintain its current valuation, Circle must continue to demonstrate a strong profit growth trajectory. From historical data, over 95% of Circle's revenue comes from interest and dividends generated by its stablecoin's fiat asset reserves (such as bank cash, short-term U.S. Treasuries, and the Circle Reserves Fund managed by BlackRock). Therefore, its revenue is highly sensitive to short-term interest rates and USDC's circulation.

Data Source: SEC
EBITDA (Earnings Before Interest, Taxes, Depreciation, and Amortization) Sensitivity Breakdown

Where:
· Net Interest Margin (NIM): Interest income obtained from earning assets (such as U.S. Treasuries).
· Supply-Driven Cost: Costs generated by USDC minting and redemption.
With the Fed's rate cut looming, the Net Interest Margin (NIM) will be compressed, and the market is pricing in a shift where transaction-based revenue growth rate will surpass the impact of rate compression.
This growth relies on the continued adoption of USDC as a global payment network, where its fee-capture capability will expand with usage, cross-border fund flows, and ecosystem integration speed. Therefore, researching the supply dynamics of USDC is crucial. This is not only a leading indicator of Circle's future revenue stream but also a core anchor of its valuation, providing real-time insights into its business model development.
Stablecoin Supply Dynamics Analysis
Currently, the total stablecoin supply has surged to $251 billion, reaching a historical high, representing a 34% increase from the previous peak of $187 billion in 2021. This growth reflects significant capital inflows and renewed confidence in the crypto ecosystem.
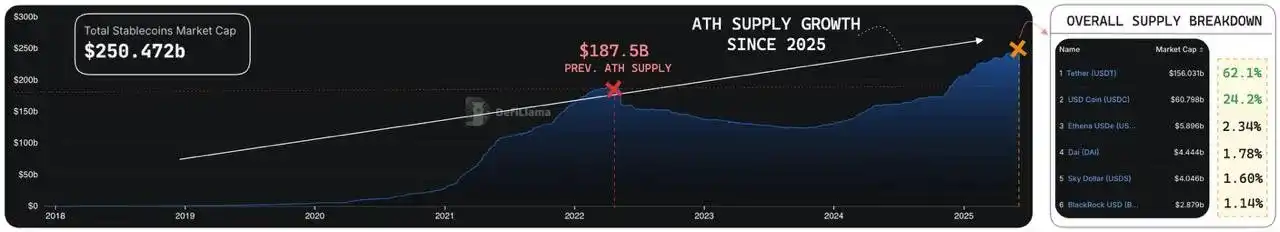
Stablecoin Historical Supply Total - Data Source: DefiLlama
Currently, USDT and USDC occupy over 86% of the stablecoin total supply. Among them, USDT leads with a market share of 62.1%, followed closely by USDC at 24.2%. These two stablecoins play foundational roles in different ecosystems, especially USDC, whose development trajectory provides us with a more transparent view of regulatory and institutional demand.
To understand the supply dynamics throughout the market cycle, we start with a simple Supply Flow formula:

Where:
· ΔSt: Net change in total supply of the stablecoin
· Mt: Minting volume (fiat → stablecoin)
· Rt: Redemption volume (stablecoin → fiat)

Translation: Deep Tide TechFlow
This dynamic reveals the core logic of stablecoin supply:
· Expansion: When minting volume exceeds redemption volume, the supply increases.
· Contraction: When redemption volume exceeds minting volume, the supply decreases.
By examining USDC's history from the perspective of expansion and contraction, we can discover its supply changes closely tied to significant milestones on the overall crypto industry timeline.

USDC Circulating Supply - Data Source: Glassnode

Translation: Deep Tide TechFlow
Rapid Expansion (From 2025 Onward)
With Circle's listing, the current circulating supply of USDC has reached a historical high of $61.2 billion. This scale reflects USDC's journey from a simple transactional stablecoin to a recognized core financial primitive. Since 2021:
· The daily transaction volume has grown by 406%, soaring from $7.77 billion to $31.52 billion.
· Daily active users have rapidly increased at a CAGR of 142.92% since 2020, reflecting its rapid adoption across major ecosystems.

Circle USDC Metrics - Data Source: Artemisxyz
The growth of USDC is mainly driven by the following three forces:
1. DeFi Revival: The resurgence of interest and participation from the crypto-native community.
2. Traditional Finance (TradFi) Adoption: Gradually being embraced by a broader traditional finance audience in settlement, cash management, and fund allocation.
3. Strategic Partnership with Coinbase: Through collaboration with Coinbase, one of the world's largest crypto user bases, USDC has gained unparalleled distribution advantages in retail, institutional, and on-chain ecosystems.
Capital Efficiency Reveals True Value
Mere supply figures are not sufficient to reflect a stablecoin's actual utility. More importantly, the real value of a stablecoin lies in its capital efficiency.

Stablecoin Trading Volume Comparison - Data Source: Artemisxyz
On the Binance platform, USDT dominates with a supply of $18.9 billion, while USDC has a supply of only $5.81 billion, about a third of USDT's.
However, in terms of trading volume, the gap is almost non-existent. In the past 30 days, USDT had a trading volume of $44.8 billion, while USDC reached $38.7 billion, trailing by only 13.6%.
By calculating the velocity of money (i.e., 30-day trading volume divided by circulating supply), we can quantify capital efficiency:

Applied to USDT and USDC:

Data Source: DefiLlama, Visaonchain
The results show that USDC's velocity is 2.81 times that of USDT, meaning each USDC dollar is traded almost three times as frequently as USDT. This indicates that USDC has faster fund movement, higher utility, and demonstrates a deeper on-chain value.
Chain-Layer Growth: Expanding to Alt-VM and Layer 2
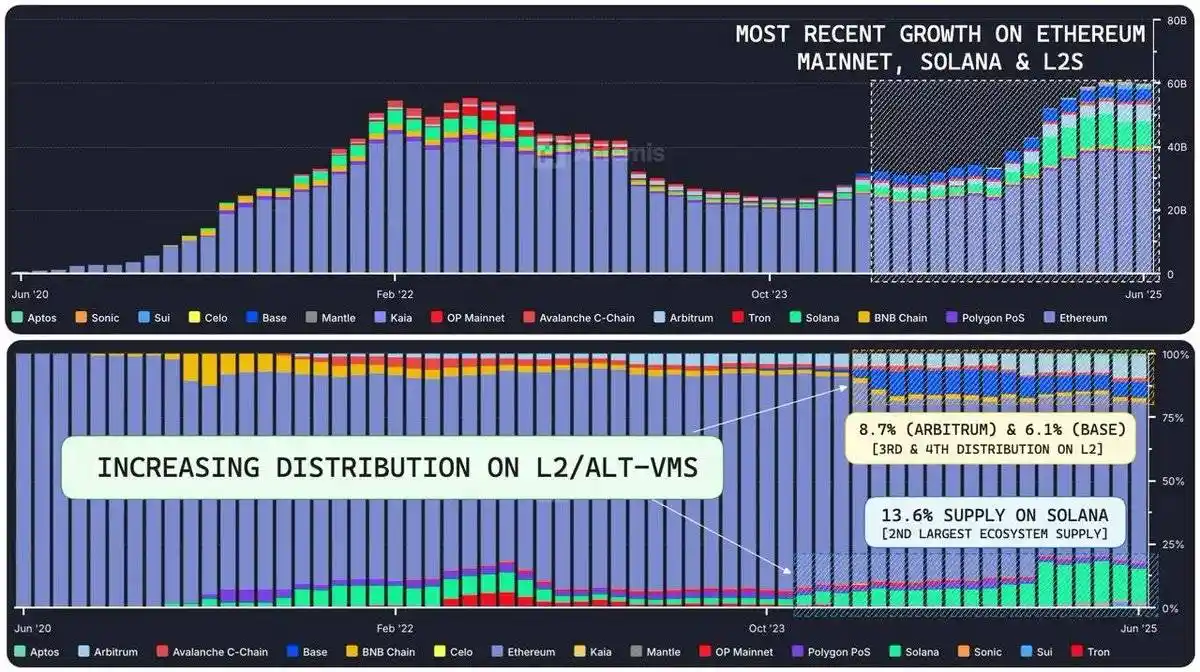
USDC On-chain Supply Distribution - Data Source: Artemisxyz
The supply growth of USDC has gradually shifted from being Ethereum-centric to a broader ecosystem, including Solana, Ethereum Layer 2, and emerging Alt-VM chains.

Current Circle USDC Supply Details - Source: Artemisxyz
Data shows that the supply of USDC is increasingly distributed across a diverse ecosystem, in line with areas of liquidity, settlement demand, and fastest-growing on-chain utility.
USDC Dominance on Solana

Solana On-chain USDC Historical Transaction Volume - Data Source: Artemisxyz
In May 2024, USDC accounted for 99.5% of the stablecoin transaction volume on Solana. Even as ecosystem activity diversified by December, USDC maintained a 96% market share.
Arbitrum's Flippening

USDC Supply Change on ArbitrumOne - Data Source: Artemisxyz
In September 2024, USDC quietly surpassed USDT on Arbitrum, becoming the leading stablecoin. At its peak, the supply ratio between USDT and USDC was 2.03 (meaning Tether's supply was more than double that of USDC). Today, this ratio has decreased to 0.2.

Driving Force Behind Hyperliquid Bridging - Data Source: DefiLlama
This reversal is primarily attributed to the explosive growth of Hyperliquid, with its Total Value Locked (TVL) soaring from $6 billion in Q4 2024 to $25 billion by the end of Q1 2025, representing a staggering 417% increase. Currently, Hyperliquid's bridging deposits have hit a record high of $36.2 billion, marking a 601% growth from the Q4 baseline.
This shift reflects a unique structural alignment between the Arbitrum core ecosystem and its scaling integration, paving the way for the stablecoin-centric trend.
USDC Supply Curve Quantitative Model: Capturing Stablecoin Supply Dynamics
Given the significance of USDC's supply dynamics, we have constructed an Autoregressive (AR) model to forecast the total supply of USDC. We chose the AR model for its simplicity, transparency, and its strong performance in capturing the local linear growth pattern of the USDC supply curve.

Data Source: Internal Model
The model is recalibrated every 90 days to capture the latest market trends while ensuring an adequately robust sample size for regression and matrix computations. Each forecasting period has a dedicated model trained on a 90-day rolling window (7 distinct regression models, each with a unique set of beta coefficients). The model uses moving averages (1 day, 3 days, 7 days, 14 days, and 30 days) as feature variables to predict the future n-day average of USDC supply, where n ranges from 1 to 7. The regression constant is set to zero to ensure the model is entirely signal-driven.
This approach has been highly effective in predicting short-term directional changes in supply. Since 2022, the model has predicted the 7-day average USDC total supply with an 80% probability of falling within ±1.5% of the forecasted result.

Data Source: Internal Model
Conclusion
The listing of Circle marks a significant turning point for the crypto industry. This is not just a fundraising event, but also indicates the previously underserved market's demand for a stablecoin in the public market. Its performance highlights investors' deep interest in compliant digital dollar infrastructure, further solidifying Circle's position as the most prominent public representative of this emerging asset class.
Currently, Circle's valuation has reached $582 billion, making it the gateway for institutional entry into the regulated digital liquidity space, with USDC at the core of this ecosystem. As USDC continues its deep integration into the expanding DeFi ecosystem and traditional financial system, its role is evolving. It is no longer just a reflection of adoption rates but has become a real-time global liquidity barometer capable of reflecting capital flows, risk sentiments, and market positioning. So far, the only way to bet on this growth is to trade Circle's stock, but the stock's specific factors often mask the underlying dynamics.
Disclaimer: The content of this article solely reflects the author's opinion and does not represent the platform in any capacity. This article is not intended to serve as a reference for making investment decisions.
You may also like
Chainlink CCIP v1.5 Upgrade Expands Secure Cross-Chain Crypto Operations – CoinGecko Report

Crypto Market Faces AI Bubble Pressure Amid Macro Volatility, Analysts Say

Bitcoin Shows Early Recovery as Markets Eye Fed Rate Cuts – QCP Asia

ECB Says Stablecoin Risks in Euro Area Remain Low Despite Market Growth