- Bitcoin is retracing after testing the top of a daily bull flag, with support seen at $100,777–$102,782.
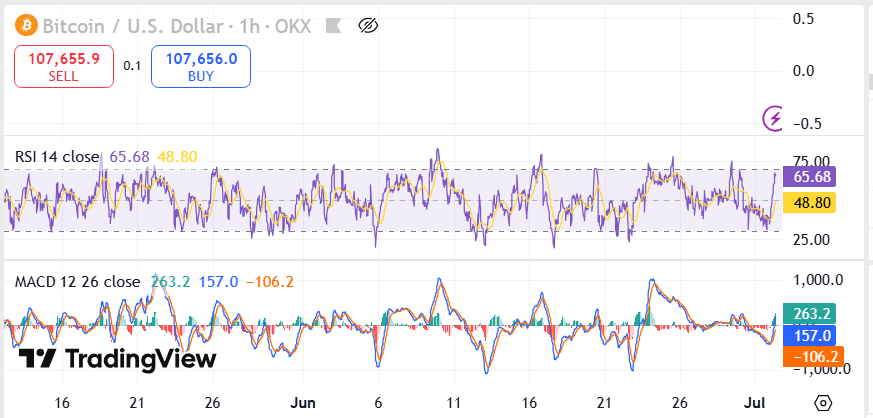
- RSI (1H) shows neutral momentum at 65.76, while MACD indicates mild bullish strength despite a weakening histogram.
- BTC maintains a bullish outlook as long as it stays above the $100.7K–$102.7K zone, with breakout potential above $107,724.
Bitcoin remains within a bullish formation on the daily timeframe, with recent price action pointing to a short-term retracement. On the chart, BTC is forming a classic bull flag, a technical structure often associated with continuation patterns. However, the price is currently retreating after touching the upper boundary of the flag.
This move follows a steady upward trend that began in early May. With BTC now trading around $107,679, traders are monitoring whether support near $100,777 to $102,782 can hold. Maintaining above this zone may preserve the current bullish structure.
Price Action Suggests Consolidation Before Possible Upside Breakout
BTC price was rejected after retesting the peak of its bull flag chart pattern and is now retracing from local highs. The current support level is between $100,777 and $102,782. If the momentum continues to decrease, then the BTC can even revisit this support point. Interestingly, this range happens to very much coincide with the 100-day moving average, hence an even more significant decision point for short-term direction.
The bigger formation remains valid even with the retracement. As long as BTC remains above this set support, the breakout potential remains valid. The rejection is orderly and consistent with previous movements within the flag and suggests that the consolidation is actually part of the ongoing setup. Price action remains above the significant $100,540 level, which further confirms the superiority of the ongoing base.
Momentum Indicators Reflect Neutral Conditions on Lower Timeframes
On the 1-hour chart, the RSI stands at 65.68, illustrating a neutral state of equilibrium in the market and contracted short-term buying forces. RSI was recently hovering around 65.19 signaling the local top before the price was rejected. The indicator is contained within a specific range, without oversold or overbought extreme indicators.
 Source: Trading View
Meanwhile, the MACD is also slightly positive and the blue MACD line is floating above the signal line. The current values are 261.5 and 154.8 respectively, and the histogram gives -106.6. These figures indicate a loss of bullish traction, but do not indicate a bearish turnover. The traders will be keen to track a convergence or even deeper divergence in these readings to determine the momentum of the next thrust.
Technical Outlook Maintains Bullish Bias Above $100.7K–$102.7K Zone
Despite short-term selling, the technical setup for BTC is still bullish. A breakout above $107,724 would validate the continuation towards resistance levels of $109,324 and $111,840. However, the focus is on whether the $100,777–$102,782 area can hold on this pullback. If it does, the dominant pattern may ultimately prove to be the upside.
As long as BTC holds within the bull flag, it keeps daily closes above $106,137 strengthening the prevailing setup. Failing to hold above the tagged support can bring bearish risk in. In the meantime, though, the trend is positive as long as price action holds above the significant demand zone.