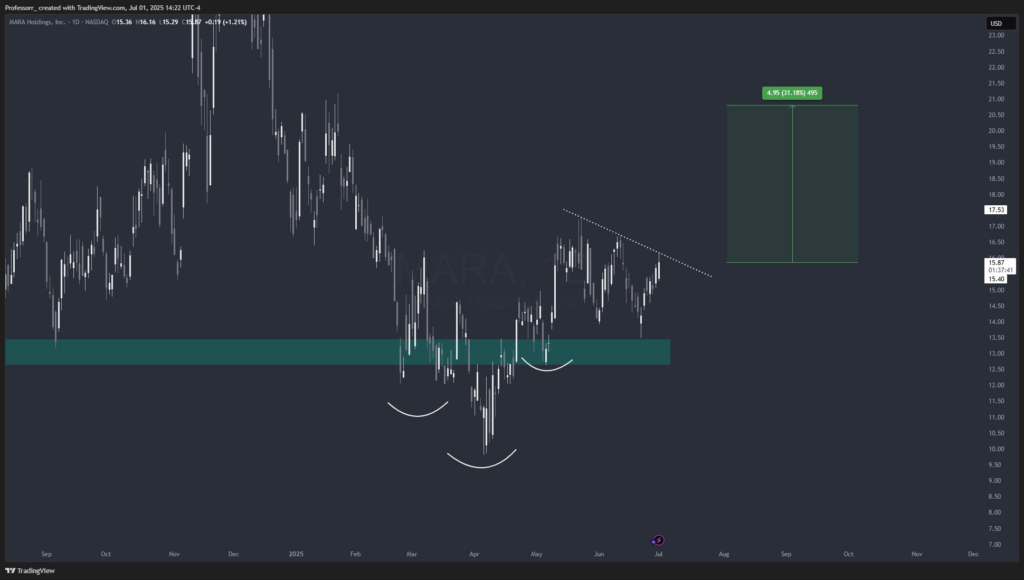
- MARA chart shows an inverse head and shoulders with price now testing a descending resistance line.
- Support zone from $14 to $15.50 held firm while traders wait for a strong breakout confirmation above $17.
- Projected upside from breakout is $4.95 or 18.18 percent with a target around $21.11 on strong trading volume.
Shares of MARA Holdings Inc. flashed a strong bullish reversal signal on July 1, 2025, following a promising chart pattern. According to a TradingView post shared by popular trader Prof (@Prof_heist), the MARA chart shows a developing inverse head and shoulders setup. This technical structure historically signals trend reversals and possible breakout moves.
 Source:
X
Source:
X
A diagonal resistance line is also forming overhead, suggesting that any breakout could trigger an aggressive upward move. Prof labels MARA as a “SpaceShip Candidate,” indicating high upside potential based on its price structure. The tweet attracted over 21.2K views in less than 24 hours.
A Reversal Pattern Draws Traders In
The inverse head and shoulders pattern visible in the chart began forming in early March 2025. A series of three distinct troughs appeared, with the middle one—the head—significantly lower than the others. This setup commonly reflects a shift from a downtrend to an uptrend.
Support around the $14.00 to $15.50 region has held firm, establishing a critical demand zone. Each retest of this zone has been met with bullish reactions, confirming strong buyer interest. With the price bouncing within this range for months, market watchers anticipate a breakout.
The overhead resistance trendline suggests a potential breakout point near the $16.50 to $17.00 mark. Should the price break above this level, a measured move projection points toward a $4.95 rally. That implies a possible 18.18% gain from the breakout.
The Data Behind the Setup
According to Prof’s analysis, the chart shows MARA currently trading at $16.16 on the NASDAQ. The bullish target sits at approximately $21.11, with a risk-to-reward ratio appearing favorable. The setup remains intact as long as the price does not fall below the neckline region.
The tweet went live at 9:23 PM UTC on July 1, and received 228 likes and 13 retweets. Prof included a note stating, “Traders will flow in fast. Process and patience here.” This comment suggests a rising interest among momentum traders, especially those watching breakout setups.
Market watchers are paying close attention to MARA’s next move. The stock has seen choppy action since late 2024, but recent formations may change its trajectory. With buying pressure building and technical patterns aligning, anticipation grows for a near-term breakout.
Will This Pattern Trigger a Rally or Trap?
The question now facing traders is clear: Will MARA deliver the breakout the chart promises, or is this another bull trap? Technical setups can offer strong signals, but real market movement is what validates them. Volume, market context, and follow-through action must now support this bullish thesis.
With momentum traders closely tracking such setups, increased volatility is expected if price breaches the descending resistance. The breakout box drawn on the chart shows a projected move toward $21.11, possibly reached over the next several weeks. Risk-conscious traders may look for confirmation before entry.
Prof’s high-engagement tweet places MARA in the spotlight as market participants seek strong trend reversals. While some traders are already positioning, others wait for validation. The market’s response to this pattern in the coming days will likely determine short-term sentiment.