Ethereum Price Prediction: Bulls Eye $3,200!

Ethereum (ETH) price has been quietly rebuilding strength after weeks of sideways movement, leaving traders wondering if a major breakout is around the corner. With the price hovering above $2,600 and key technical signals flashing early bullish signs, all eyes are on whether ETH price can push above its next resistance and reclaim the $3,000 level soon. In this article, we break down Ethereum price daily chart, examine support and resistance levels, study the momentum indicators, and run a few quick calculations to predict where ETH could be headed next. If you’re watching ETH price closely, this analysis will help you understand what comes next for the world’s second-largest cryptocurrency.
Ethereum走势观察:以太坊能否积蓄力量迎来更大变动?
 ETH/USD Daily Chart- TradingView
Looking at the daily chart you shared, Ethereum (ETH) price is trading around $2,620–$2,623 with a steady upward bias. The Heikin Ashi candles show a period of consolidation above $2,500, forming a tight range with slightly higher lows — a sign that buyers are slowly regaining control.
The Relative Strength Index (RSI) sits at 59.9, just shy of the crucial 60 mark that often precedes a stronger push. It means ETH price is not overbought yet — there’s room for a continuation. The RSI is also comfortably above its moving average (around 52), showing upward momentum is building again.
What Are the Key Levels to Watch on This ETH Price Chart?
The chart highlights Fibonacci extension levels, which show clear upside targets. The visible Fibonacci grid suggests a key short-term resistance near $2,750–$2,800, with the next levels around $3,000 and $3,200.
Given the previous bounce from the May lows, the rally leg was about $2,000 to $2,900 — a move of $900. If we take the recent low near $2,400 and add a similar swing, a measured move target comes to:
$2,400 + $900 = $3,300
This aligns well with the Fibonacci cluster you marked above $3,200. It suggests that if Ethereum price breaks above $2,750 with volume, a move towards $3,200–$3,300 is technically realistic.
How Strong Is the Current Support Zone?
On the downside, the chart shows ETH price has repeatedly defended the $2,400–$2,500 region. This has now formed a solid base. Multiple tests without breakdown imply that whales are likely accumulating below $2,500.
As long as Ethereum price stays above this floor, the short-term risk remains limited. If price dips back to this zone, it may act as a springboard for bulls to push higher again.
What Does the RSI Tell Us About Momentum?
The RSI reading near 60 is promising. Typically, for ETH price, when the RSI crosses 60 on the daily, it signals the start of a momentum phase that can last a few weeks. For example, the big rally earlier this year started when RSI went from 45 to 65, and price surged nearly 40%.
Using a similar percentage, a 40% move from the recent swing low ($2,400) could target:
$2,400 + (0.40 × $2,400) = $2,400 + $960 = $3,360
Again, this matches the measured move and the upper Fibonacci zone.
Ethereum Price Prediction: Where Could ETH Be Headed Next?
Based on the price structure, support zone, and RSI momentum, Ethereum price looks ready to test $2,750–$2,800 soon. If bulls manage to break and close above $2,800 on strong daily volume, the next logical leg is toward $3,200–$3,300.
If the market stalls or Bitcoin pulls back, ETH price could retest $2,500–$2,550 as support. But unless that level is lost with heavy selling, the bias stays bullish.
ETH行情有望冲击$3,200
Ethereum price daily chart shows it is quietly building strength for a fresh breakout. With RSI momentum intact, a strong support base, and clear Fibonacci targets, traders should watch the $2,750–$2,800 level like a hawk. A breakout above that could unlock the path to $3,200–$3,300 in the coming weeks — giving bulls nearly a 20–25% upside from current levels. For now, the trend remains constructive — but always keep an eye on Bitcoin for confirmation. If BTC stays stable , ETH price next move could surprise on the upside.
Disclaimer: The content of this article solely reflects the author's opinion and does not represent the platform in any capacity. This article is not intended to serve as a reference for making investment decisions.
You may also like
Coinpedia Digest: This Week’s Crypto News Highlights | 29th November, 2025
QNT Price Breaks Falling Wedge: Can the Bullish Structure Push Toward $150?

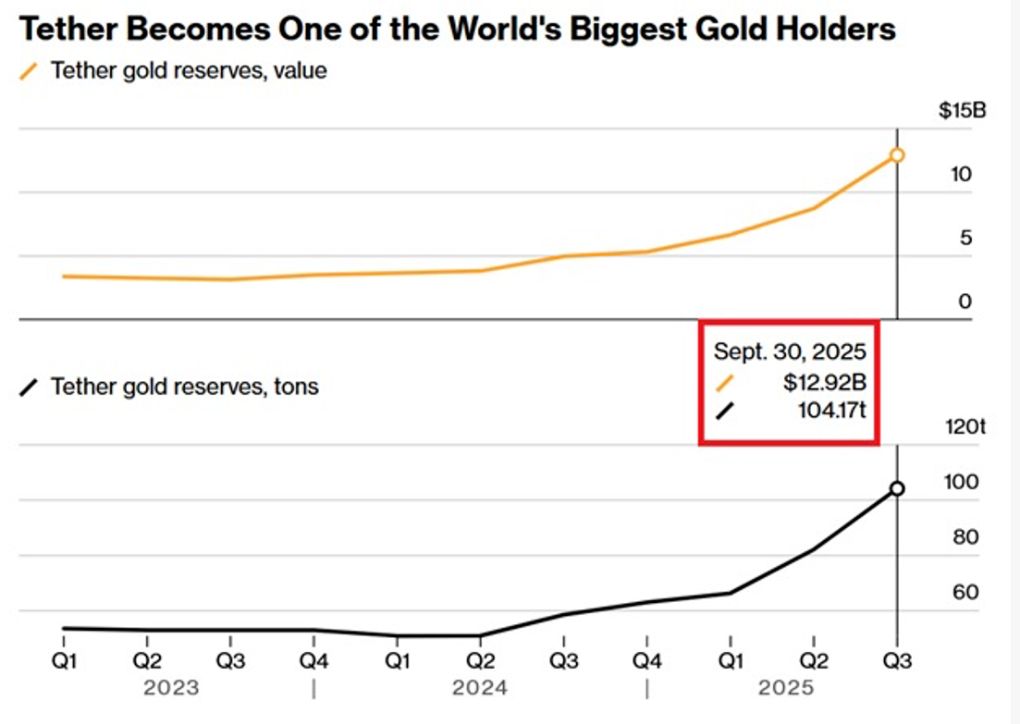
Digital dollar hoards gold, Tether's vault is astonishing!
The Crypto Bloodbath Stalls: Is a Bottom In?