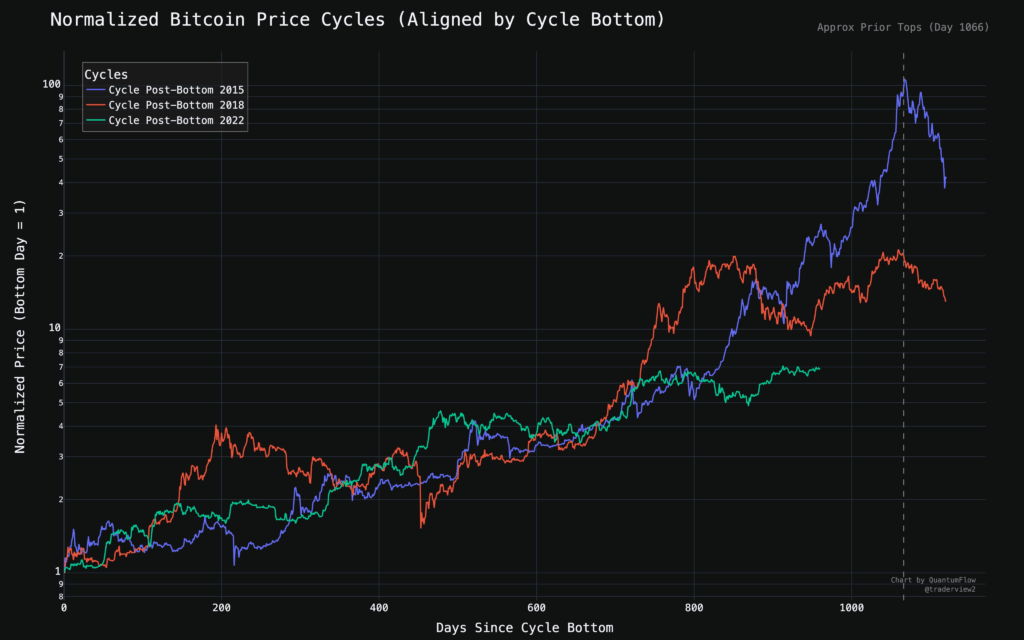
- Bitcoin’s 2022 cycle has now reached the same day range where major surges happened in past cycles
- The chart shows that the 2015 and 2018 cycles peaked near Day 1066, which gives the current market a 100-day window
- Normalized price lines reveal the current trend is still closely following both past breakout timelines
A recently published chart comparing Bitcoin’s price movements across three major cycles shows the cryptocurrency remains historically aligned as of Day 966. The data, released July 8, 2025, by on Twitter, aligns Bitcoin’s current post-bottom trajectory with the 2015 and 2018 cycles.
 Source:
X
Source:
X
With only 100 days remaining before the average historical cycle top (Day 1066), traders are eyeing a potential last leg surge. The chart, created by QuantumFlow, presents normalized Bitcoin price cycles where Day 0 represents each market cycle’s lowest point.
According to the visual data, Bitcoin’s 2022 post-bottom cycle (green line) continues to track previous cycles’ patterns, particularly the 2015 cycle (blue) and 2018 cycle (red).
Historical Patterns Reveal Predictable Post-Bottom Behavior
Each Bitcoin cycle appears to follow a consistent trend of bottoming out, followed by steady gains and a climactic final surge. The chart illustrates this pattern using logarithmic scaling for normalized prices, revealing key growth similarities.
The 2015 post-bottom cycle peaked around Day 1066 with nearly a 100x return from its bottom, showcasing its historic strength. Meanwhile, the 2018 cycle peaked at a lower multiple, around 20x, also near Day 1066. Both cycles delivered exponential growth before their tops.
In contrast, the current cycle (2022) shows more gradual gains, sitting slightly above 3x growth as of Day 966. This modest ascent has nonetheless mirrored the earlier stages of the previous cycles, supporting the theory of a yet-to-come final leg.
With the 1066-day peak acting as a benchmark, historical data aligns with the idea that Bitcoin’s next major move may be imminent.
Data-Backed Confidence Among Traders
Trader and analyst referenced this chart as support for a bullish thesis originally shared in April 2025. In the new post, he points to the consistency of historical tops occurring around Day 1066, offering insight to those anticipating Bitcoin’s next significant move.
By using normalized price metrics and aligning cycles at their respective bottoms, the chart creates an unbiased view of performance. Each curve begins at a normalized price of 1.0, ensuring clarity and comparability across the three cycles.
The vertical dashed line on the chart pinpoints Day 1066, marking where major tops previously occurred. With only 100 days to go from the chart’s current position, some traders see this as a pivotal opportunity.
As engagement grows, many comments echo the sentiment that “history repeats itself,” suggesting strong community belief in cycle-driven price action.
Will Bitcoin Break Tradition or Continue Its Cycle?
The central question now is whether Bitcoin will again follow through with a final explosive rally, as seen in prior cycles. Historical precedent places that top near Day 1066, drawing increased attention to the next three months of market behavior.
With over 20.2K views and hundreds of engagements within hours of posting, the chart has sparked renewed interest. Many traders reference the 4-year cycle theory, often used to frame Bitcoin’s behavior across halving events.
As Bitcoin stands at a critical juncture, the coming days will test whether this data-backed narrative holds—or diverges into new territory.