
Ethereum Price Breaks $3,000 as Crypto Market Rallies with Bitcoin

Ethereum Breaks Key $3,000 Level as Crypto Market Rides Bitcoin Wave
Ethereum ($ ETH ) has officially crossed the $3,000 mark, following Bitcoin's explosive breakout to a new all-time high. Although ETH hasn’t yet reached a new ATH itself, this milestone is significant—it marks Ethereum’s strongest move in months, driven by the same institutional fuel that sent Bitcoin flying past $118,000.
ETH/USD 1-hour chart - TradingView
Much like $ BTC , Ethereum has seen major buying pressure from institutional players and corporate treasuries. Several blockchain-focused funds and tech giants have been openly accumulating ETH, betting on the future of decentralised infrastructure, smart contracts, and Ethereum’s growing role in tokenization, AI integrations, and L2 adoption.
ETH/USD Chart Analysis – Riding the Momentum
Ethereum's chart on the 1-hour timeframe mirrors Bitcoin’s surge nearly step for step:
Smooth MA Cross & Trend Acceleration
The crossover of the 9 EMA above the 21 EMA on July 8 set the tone for a strong uptrend. The orange arrows highlight points where ETH tested support and bounced cleanly, continuing the bullish momentum.
Key Resistance Break: $2,732
ETH pushed above $2,732 and turned it into support—this confirmed strength. Once this happened, ETH never looked back and powered its way up to $2,980.
Psychological Resistance: $3,000
Ethereum touched the $3,000 zone and is currently stabilizing just under it. Traders are now watching for either consolidation or a clean breakout that could send ETH toward $3,200 and beyond.
RSI at 74.59 – Strong but Cautious
The RSI remains elevated, showing strong momentum, but traders should watch for any bearish divergence or overbought corrections in the short term.
Overall, the Ethereum chart structure is nearly identical to Bitcoin’s , reinforcing the idea that the entire crypto market is currently moving in sync—led by Bitcoin, but confirmed by altcoin strength.
Ethereum Trading Update & New Opportunities
Disclaimer: The content of this article solely reflects the author's opinion and does not represent the platform in any capacity. This article is not intended to serve as a reference for making investment decisions.
You may also like
Do Kwon Wants Lighter Sentence After Admitting Guilt

Bitwise Expert Sees Best Risk-Reward Since COVID

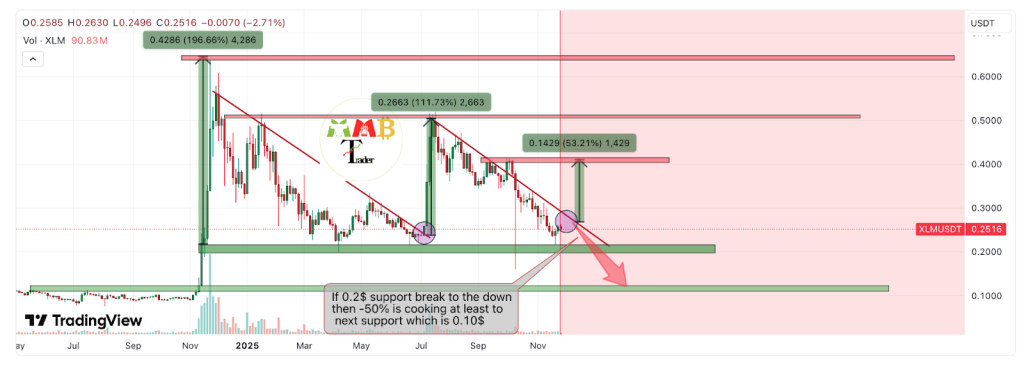
Stellar (XLM) Price Prediction: Can Bulls Push Toward $0.30 in December?
21Shares XRP ETF Set to Launch on 1 December as ETF Demand Surges