Date: Fri, July 18, 2025 | 11:45 AM GMT
The cryptocurrency market remains strongly bullish, crossing the historic $4 trillion market cap milestone for the first time. Ethereum (ETH) continues to lead the charge, posting 20% weekly gains and now jumping to $3,600. This broad market momentum is spilling over into major altcoins , with Aptos (APT) emerging as a token to watch.
APT has climbed 5% in the past 24H, extending its 30-day gains to 25%. However, beyond the short-term price action, a fractal pattern spotted on the weekly chart could be signaling that Aptos is gearing up for a much larger rally — one that could echo some of the biggest altcoin runs of past cycles.
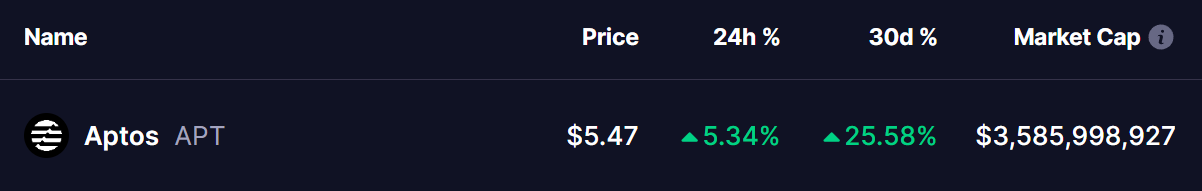 Source: Coinmarketcap
Fractal Pattern Suggests APT Is Following POL’s Footsteps
According to prominent crypto analyst Osemka , Aptos’ price structure is showing striking similarities to Polygon (POL)’s MATIC during its late 2020 accumulation phase — a period that preceded a parabolic 10x bull run. Both charts show Wyckoff-style accumulation, marked by repeated rounded bottoms and a breakout above a long-term resistance zone, which in MATIC’s case, unleashed a massive rally.
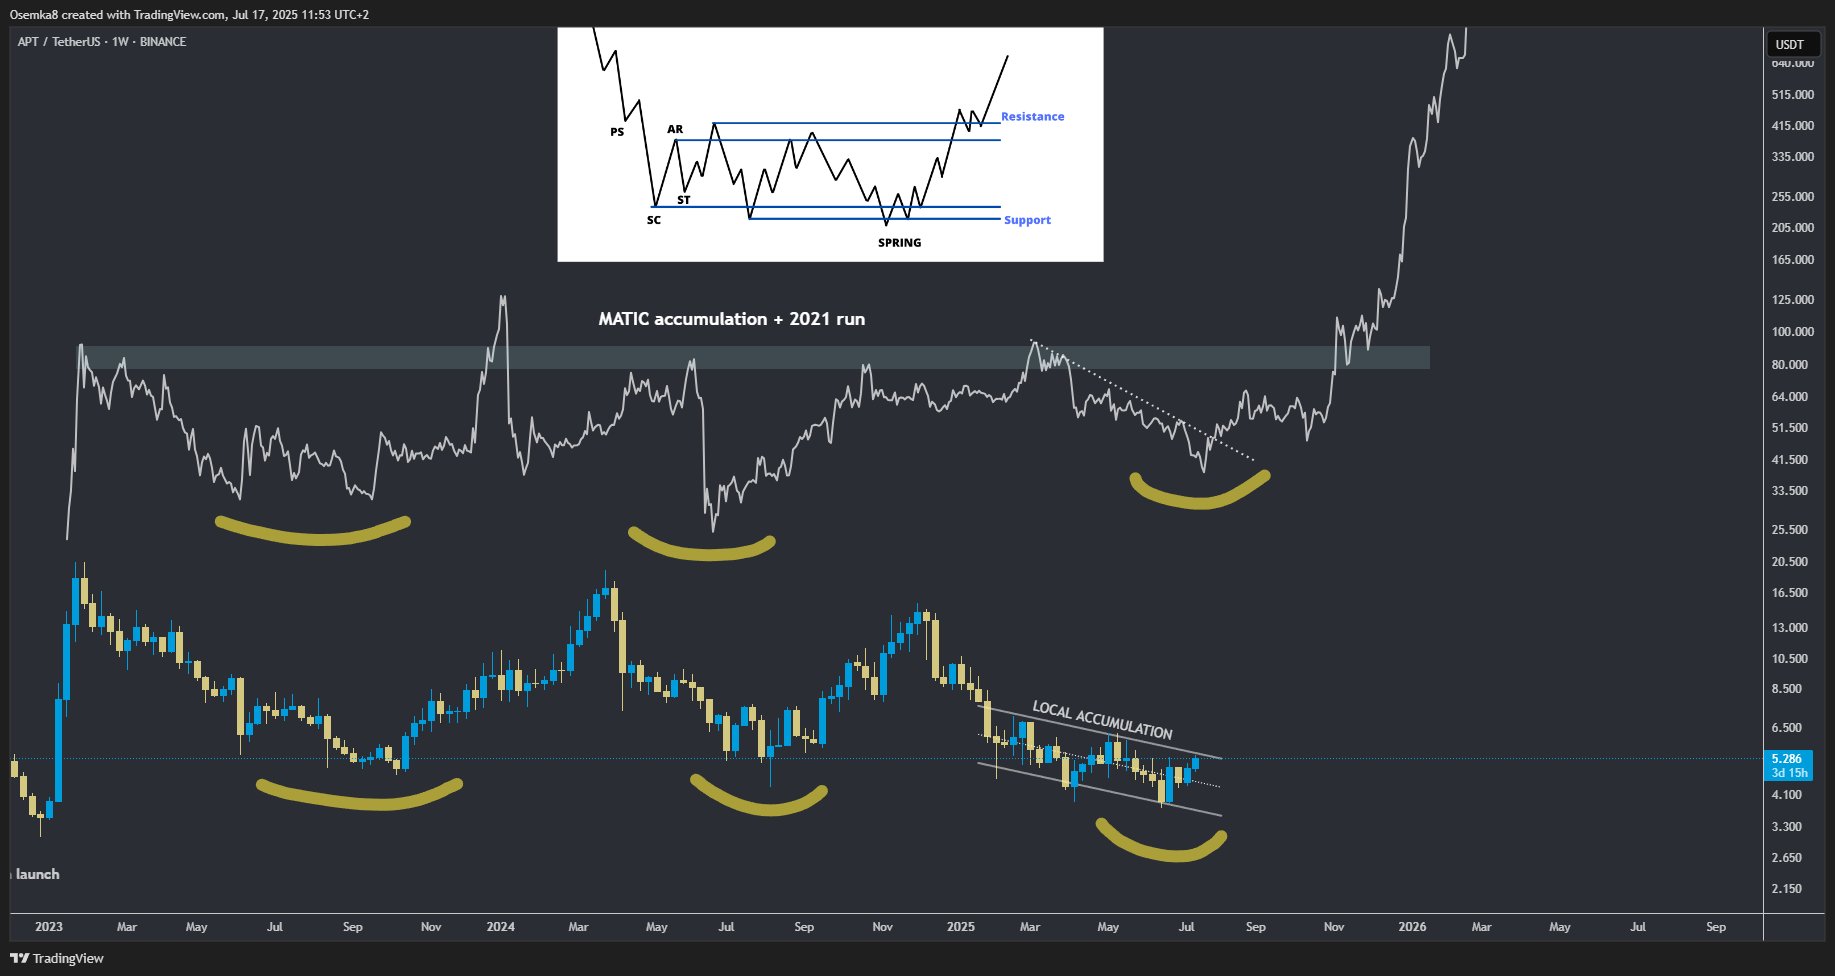 MATIC and APT Fractal Chart/Credits: @Osemka8 (X)
Currently, APT appears to be forming its own local accumulation zone, repeatedly bottoming around $4 and coiling tightly under a descending resistance line. If this Wyckoff accumulation fractal continues, APT may be on the verge of a similar explosive breakout.
What’s Next for APT?
If Aptos breaks above its accumulation structure and follows the fractal path, it could trigger a powerful bullish run, potentially targeting the $50 level — roughly a 9x move from current prices. Such a rally would mirror MATIC’s historical breakout, where patient accumulation gave way to exponential gains.
For now, traders will be watching closely for confirmation signals — specifically, a breakout above the descending resistance and a surge in trading volume — to validate the fractal’s setup.
With broader market momentum favoring bulls and APT’s chart aligning with a proven historical pattern, Aptos may be positioning itself as one of the next breakout candidates in the altcoin market.