Bitcoin (BTC) is currently facing selling pressure, with its price down 0.75% and approaching critical support at $117,000. A break below this level could lead to further declines toward $115,000-$116,000 in the short term.
-
Bitcoin price dropped 0.75% in the last 24 hours amid midweek market selling.
-
Hourly charts indicate BTC is close to breaking local support at $117,421, signaling potential further downside.
-
COINOTAG analysis highlights a possible test of $112,000 support if bearish momentum persists through the week.
Bitcoin price analysis reveals key support tests at $117,000 and potential declines. Stay updated with COINOTAG for the latest BTC market insights.
What Is Driving Bitcoin’s Price Decline Amid Midweek Selling Pressure?
Bitcoin’s recent 0.75% price drop reflects increased selling activity during midweek trading sessions. Market participants are closely watching the hourly chart, where BTC is nearing a critical support level at $117,421. A breach of this support could accelerate downward momentum, testing lower price zones.
How Does the Hourly Chart Signal Potential Further Declines for BTC?
The hourly price action shows Bitcoin approaching the $117,421 support line. If this level fails to hold, BTC may quickly test the $117,000 mark. This short-term bearish signal is crucial for traders assessing risk and potential entry points. According to COINOTAG’s technical review, a daily close below $117,000 increases the likelihood of a drop to the $115,000-$116,000 range.
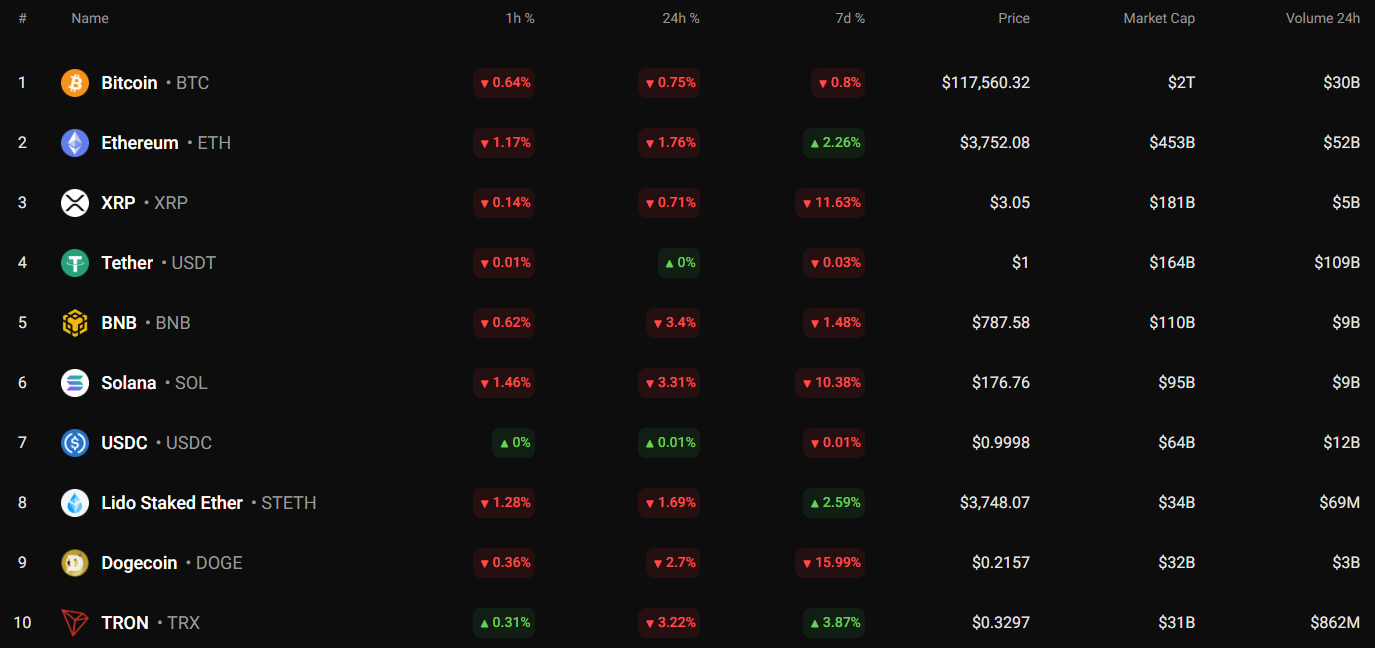
Top coins by CoinStats
What Are the Midterm Outlook and Key Support Levels for Bitcoin?
From a midterm perspective, Bitcoin’s buyers have struggled to maintain upward momentum following the previous bullish close. The current price action suggests a weakening trend, with a potential test of the $112,000 support level if selling pressure continues unabated. BTC is trading around $117,474 at press time, indicating a cautious market sentiment.
Why Is the $112,000 Support Level Critical for BTC Traders?
The $112,000 support acts as a psychological and technical barrier for Bitcoin. A failure to hold this level could trigger further sell-offs and increased volatility. COINOTAG experts emphasize monitoring this zone closely, as it may define the next major directional move for BTC in the coming days.
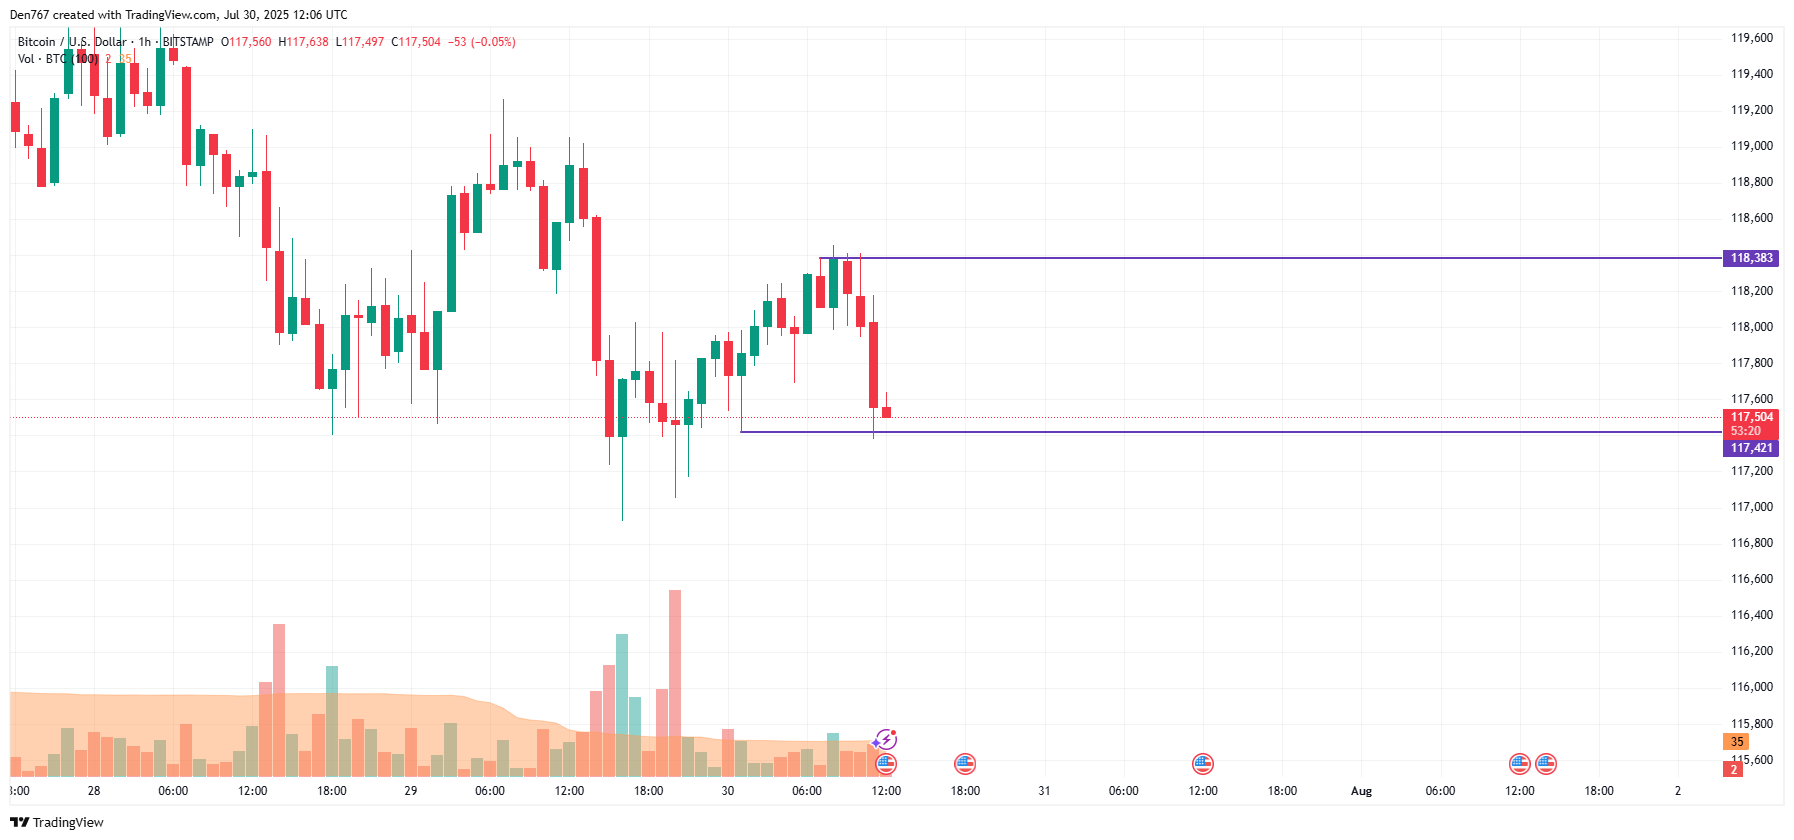
Image by TradingView
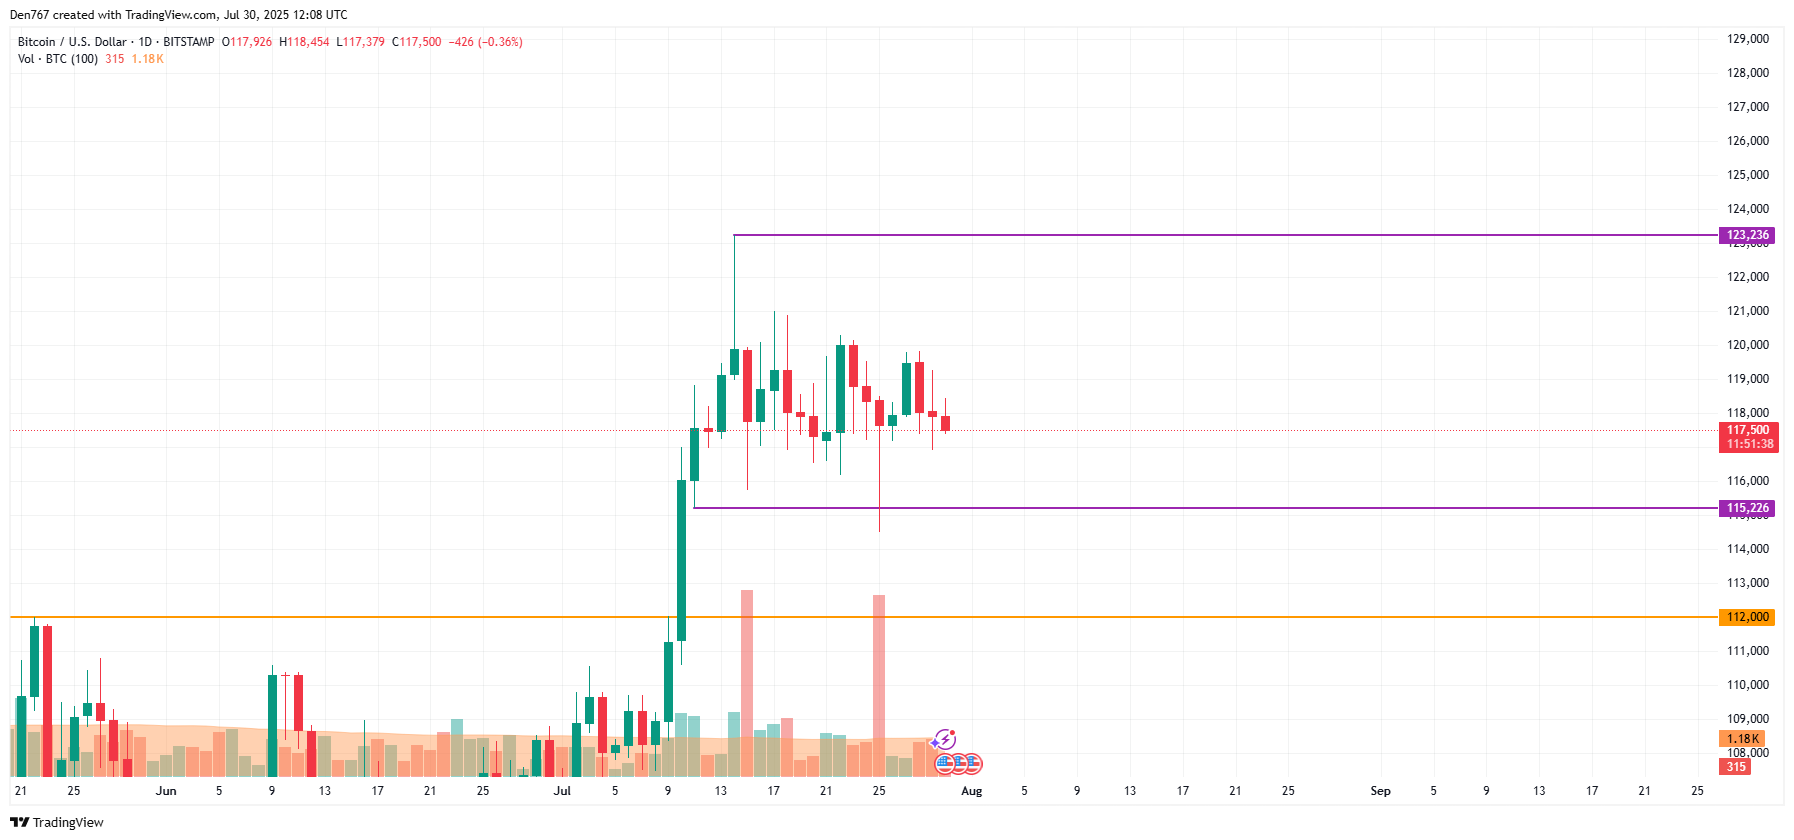
Image by TradingView
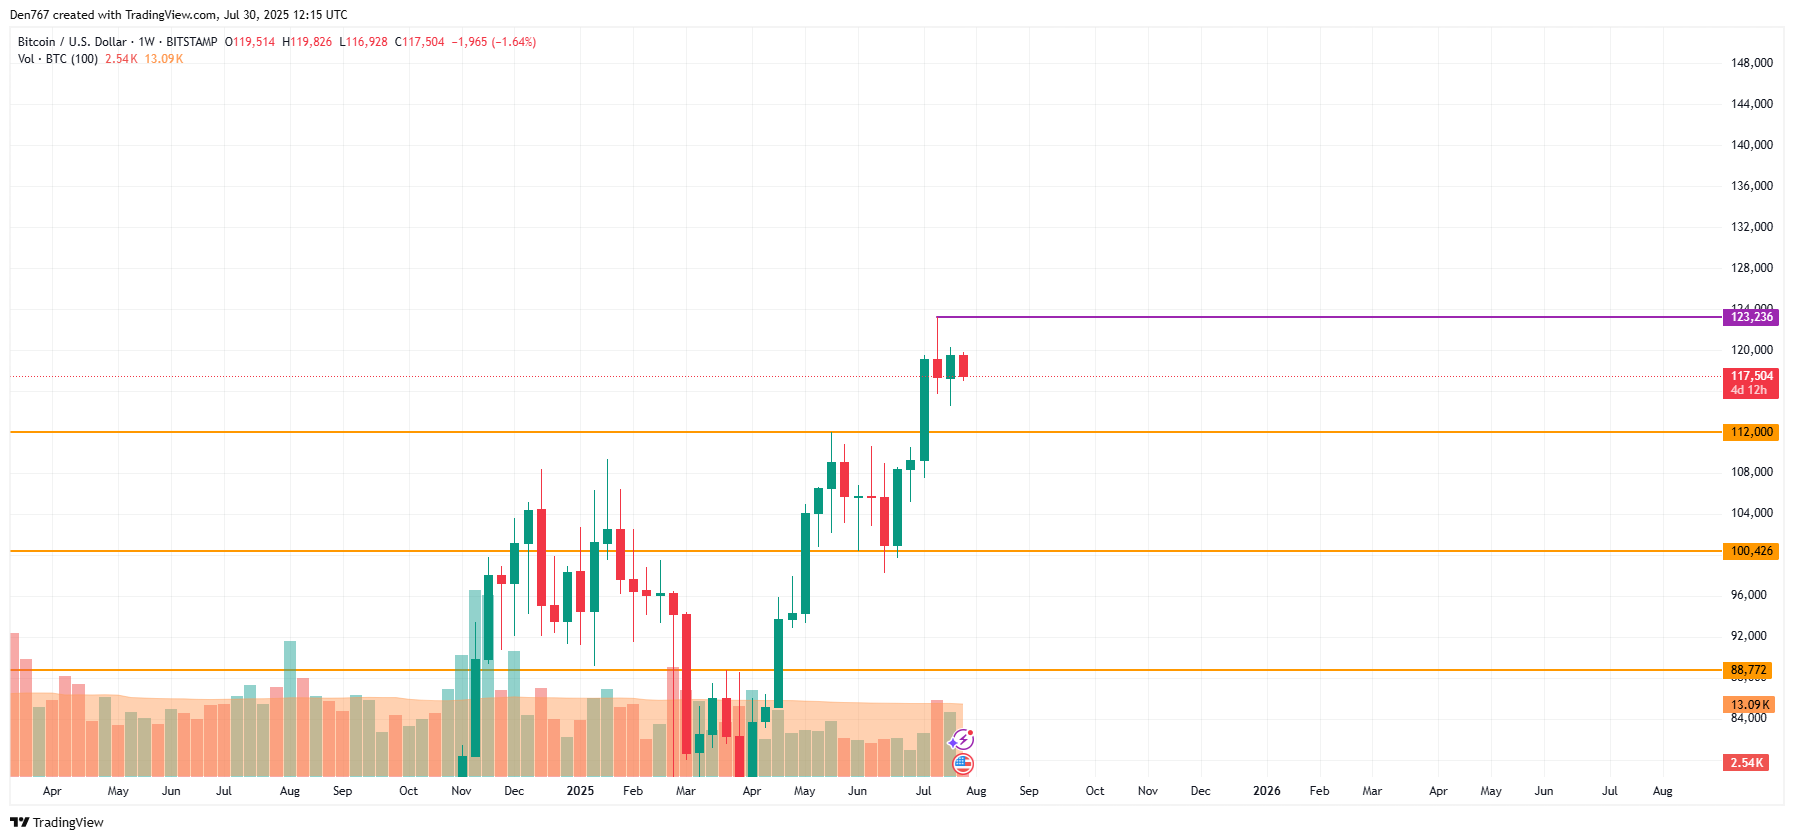
Image by TradingView
| Local Support | $117,421 | Hourly chart critical support |
| Key Support Zone | $117,000 | Potential breakdown triggers further decline |
| Midterm Support | $112,000 | Major psychological and technical barrier |
Frequently Asked Questions
What factors influence Bitcoin’s support levels during a sell-off?
Bitcoin’s support levels are influenced by market sentiment, trading volume, and technical indicators. During sell-offs, these levels act as potential price floors where buyers may step in to stabilize the price.
Why is the $117,000 support level important for Bitcoin traders?
The $117,000 support level is crucial because it represents a key technical barrier. Holding this level suggests market strength, while breaking it could lead to accelerated selling and lower prices.
Key Takeaways
- Midweek selling pressure: Bitcoin price dropped 0.75%, signaling bearish momentum.
- Critical support levels: BTC is testing $117,421 hourly support and $117,000 key zone.
- Potential downside: A break below support may lead to declines toward $115,000-$116,000 and possibly $112,000.
Conclusion
Bitcoin is currently under pressure as it approaches crucial support levels, with the potential for further declines if bearish momentum persists. Traders should closely monitor the $117,000 zone for signs of stability or breakdown. COINOTAG will continue providing timely updates to help navigate the evolving BTC market landscape.
-
Bitcoin faces midweek selling pressure, testing critical support levels around $117,000, signaling potential further declines.
-
Hourly and daily charts indicate bearish momentum that could push BTC towards $115,000-$116,000 and possibly $112,000 support.
-
COINOTAG experts emphasize monitoring these levels closely to anticipate market direction and trading opportunities.
Bitcoin price analysis highlights key support tests amid midweek sell-off. Stay informed with COINOTAG for expert crypto market insights.
Bitcoin Price Update: What Does the Current Market Tell Us?
Bitcoin (BTC) is experiencing a 0.75% price decline as midweek trading sessions see increased selling pressure. The hourly chart reveals BTC is approaching a significant support level at $117,421, which, if broken, may trigger further downside momentum. This development is critical for traders assessing near-term price action.
What Are the Technical Indicators Suggesting for BTC’s Next Moves?
Technical analysis shows that if Bitcoin closes below the $117,000 support on the daily chart, it could continue falling toward the $115,000-$116,000 range. The midterm outlook remains cautious as buyers have not sustained recent bullish advances, increasing the risk of testing lower support at $112,000.