Date: Wed, July 30, 2025 | 09:40 AM GMT
The broader cryptocurrency market is undergoing a pullback after Ethereum (ETH) tested its multi-year resistance around $3,940 before easing to $3,775. This pullback has weighed on major altcoins ,, with The Graph (GRT) sliding 5% today and trimming its monthly gains to 17%.
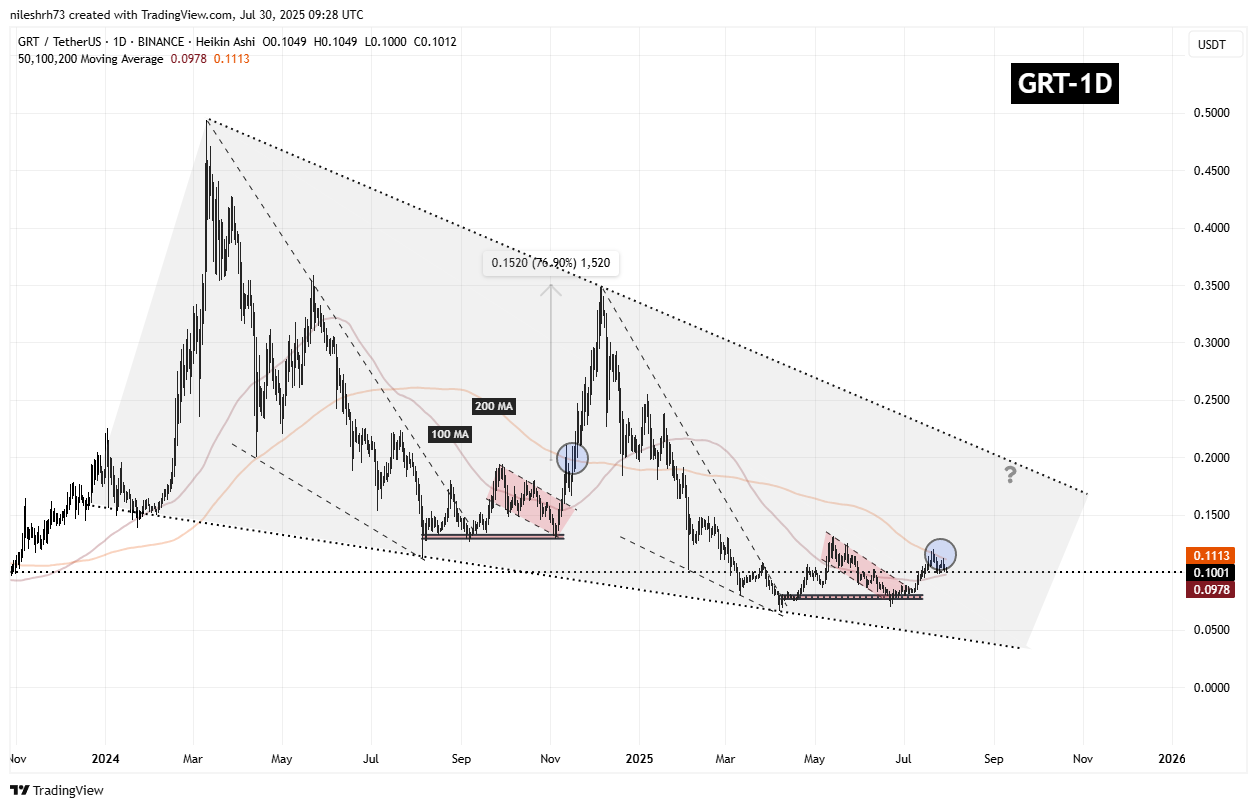
However, a deeper look into GRT’s daily chart suggests this may just be a healthy retest within a larger bullish setup. A familiar fractal pattern — which led to a major breakout in 2024 — is beginning to resurface.
 Source: Coinmarketcap
Fractal Setup Hints at a Bullish Reversal
Back in late 2024, GRT broke out of its descending channel, reclaimed the 100-day moving average, and shortly after, cleared the 200-day MA. It then underwent a short consolidation phase — a typical retest — before exploding 76% to the upside.
 The Graph (GRT) Daily Chart/Coinsprobe (Source: Tradingview)
Fast forward to now, and the pattern appears to be repeating.
GRT has once again broken out of a descending channel and reclaimed its 100-day moving average. Its current price action is hovering around the 200-day MA at $0.1113, consolidating in a tight range — marked by the same type of correction that preceded its prior breakout. The resemblance to the 2024 structure is striking and may be more than coincidence.
What’s Next for GRT?
If GRT can hold its ground above the 100-day MA at $0.0978 and manage a clean break above the 200-day MA, this current consolidation could mark the beginning of another leg higher. Should the fractal fully play out, GRT could climb toward the upper resistance of the broader falling wedge pattern — near the $0.19–$0.20 range — offering a potential 90% upside from current levels.
