Solana Price Breaks Down, Loses Key Level —Could This Be A “Bear” Trap?

Solana price erased most of its July gains after breaking below key support. Network activity is plunging, shorts are stacked high, and bearish momentum dominates; but could a sudden reversal still catch traders off guard?
Solana’s price is cracking. Despite gaining 12% in July, the token has now corrected by more than 7.5% in the past 24 hours, wiping out most of those gains.
The sharp drop has dragged Solana below a crucial support level, breaking down from a bearish pattern that was looming on the daily chart. Traders are now left wondering: Was this just a temporary shakeout, or a sign that bears are tightening their grip?
Active Addresses Collapse As Demand Fades
Daily active addresses on Solana peaked at 4.1 million on July 21, followed by the SOL price surging past $200. This signalled that a strong network activity backed the rally.
But momentum quickly faded. Within two sessions, active addresses dropped by 23.7%, and Solana’s price followed suit, falling to $176. As of now, the count sits around 3.2 million, marking a sustained decline.
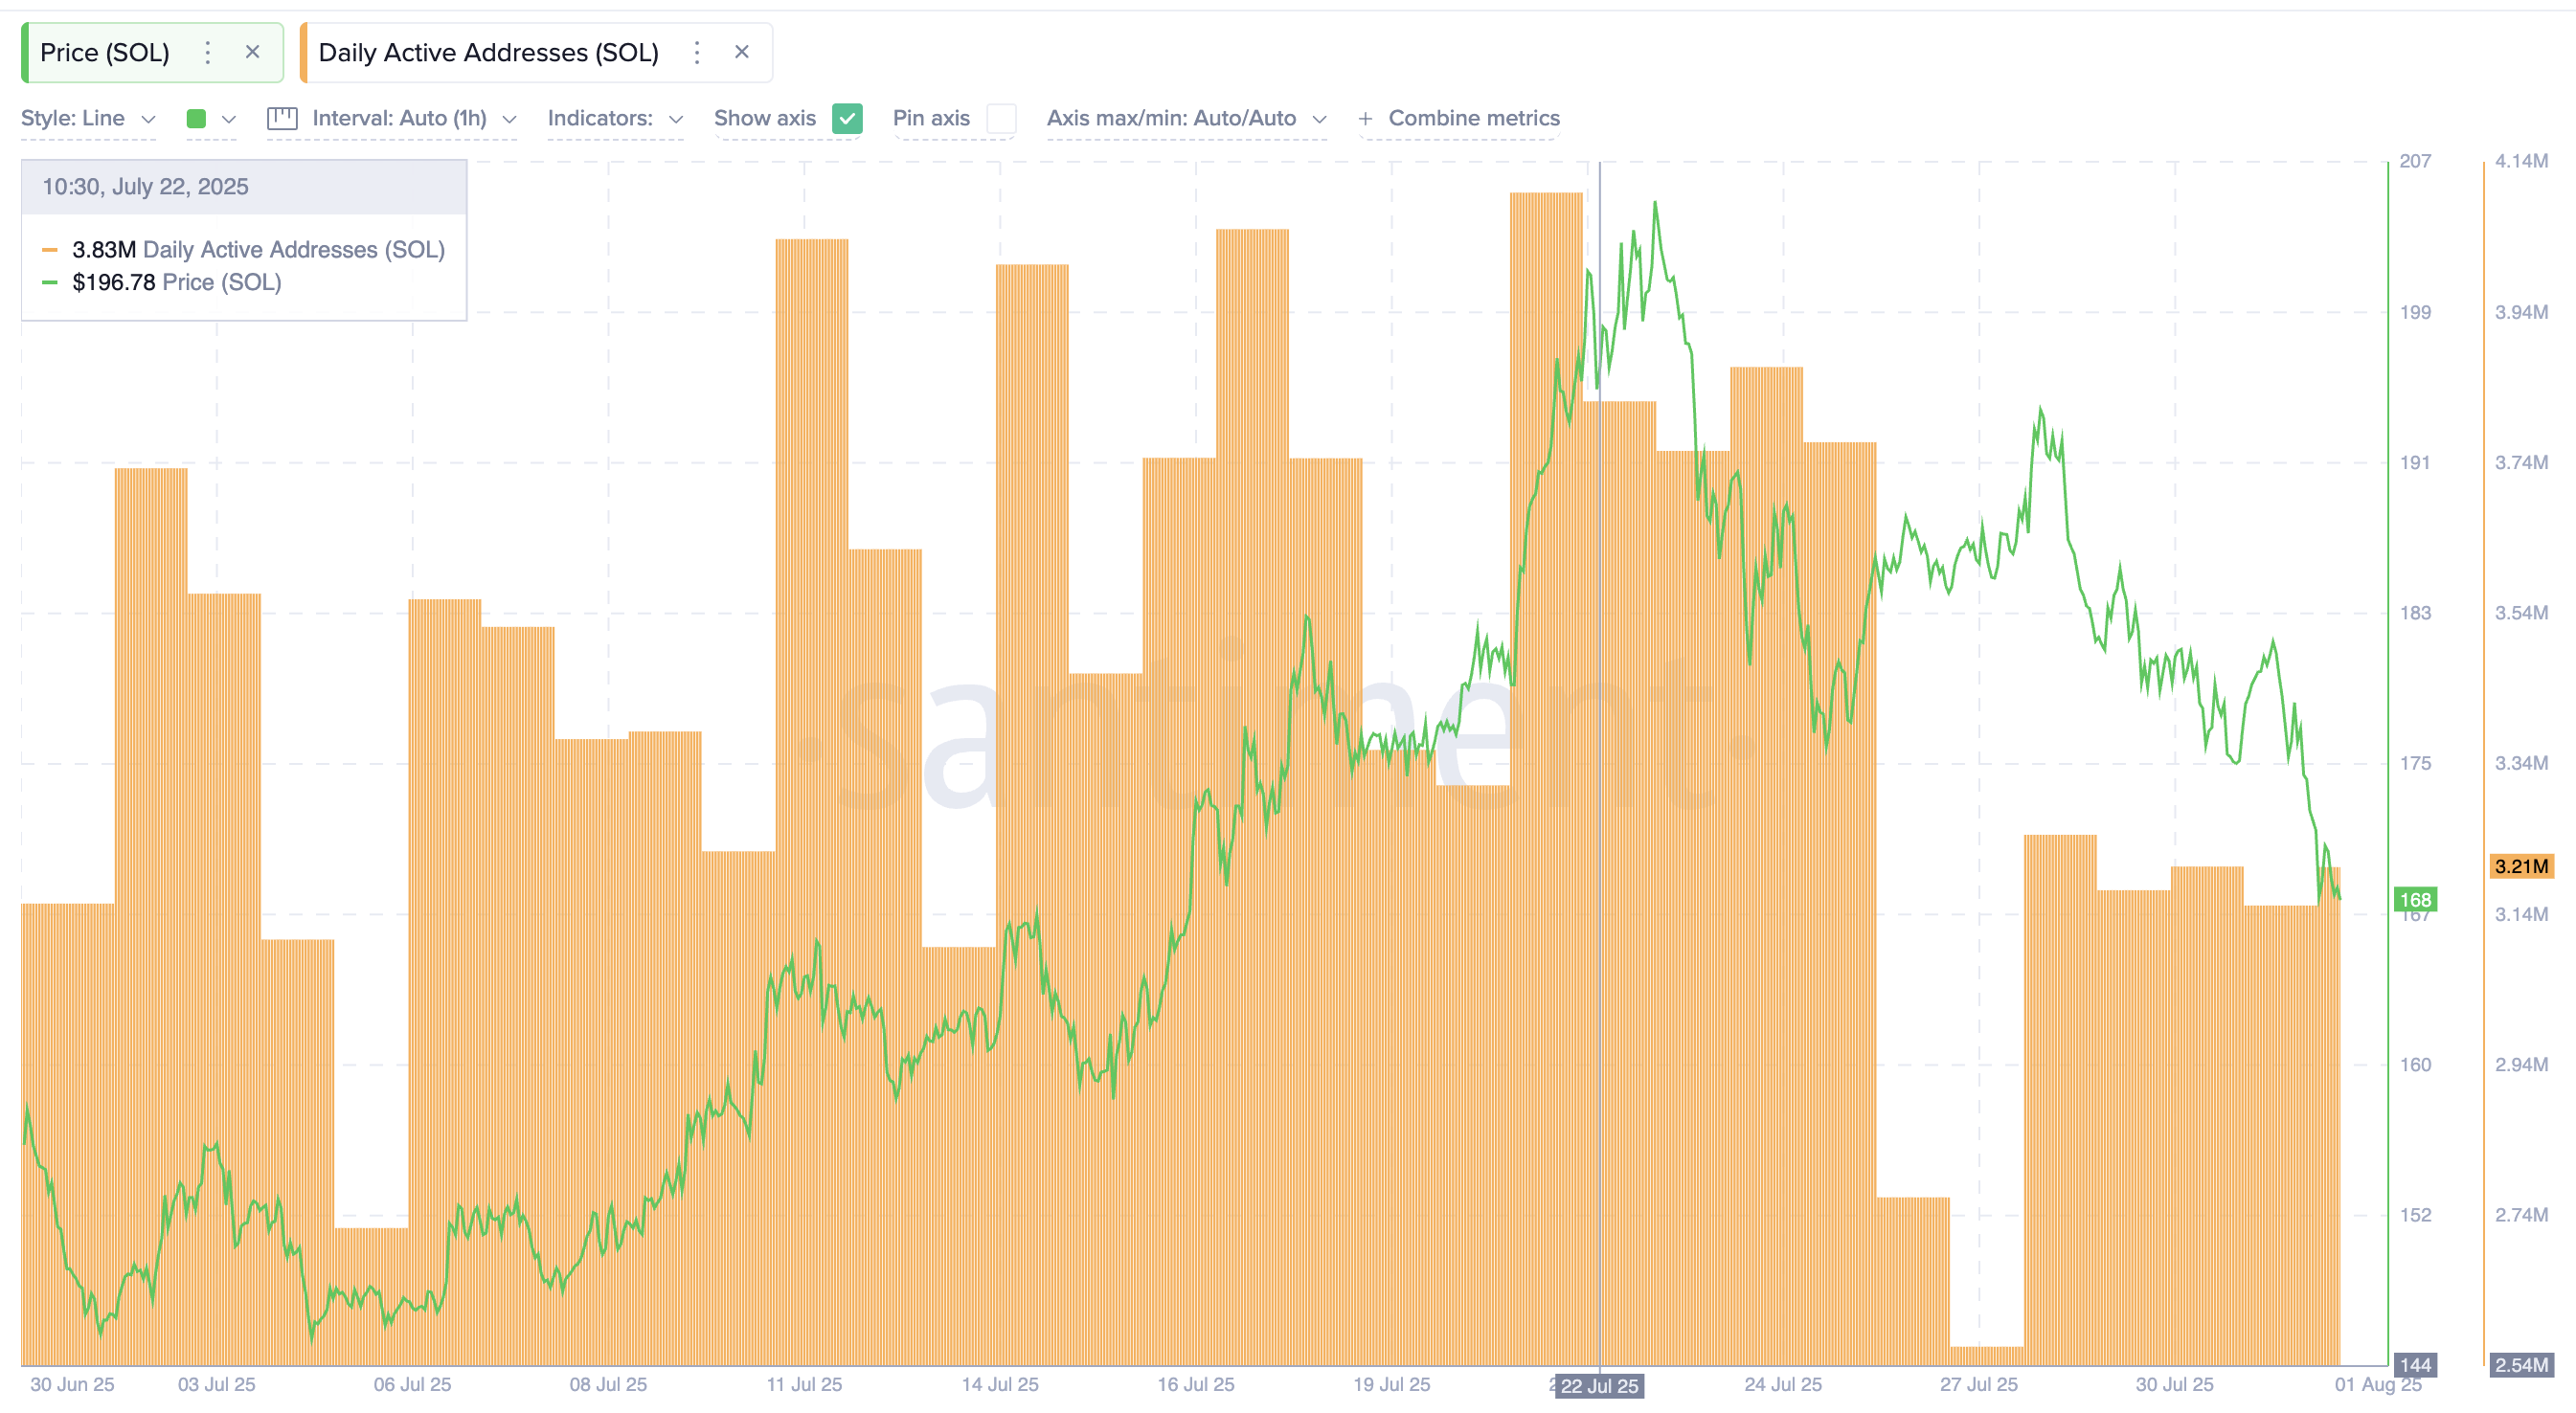 Solana price and network activity:
This matters because active addresses measure real network demand. Without rising participation, rallies struggle to hold. The latest breakdown below the ascending wedge (pattern revealed later in the post) came as activity kept falling, showing that Solana’s bullish push lacked the support needed to defend key levels.
Shorts Dominate Liquidation Map, Confirming Bearish Bias
The derivatives market shows traders are leaning heavily bearish. This finding aligns with the dip in network activity, rendering the entire price structure weak.
Open short positions now stand at $1.69 billion, while longs trail at just $244 million. Normally, a high short ratio can signal a funding rate play or setups for a squeeze. But with longs so low, this isn’t a game of funding wars; the market is genuinely skewed bearish.
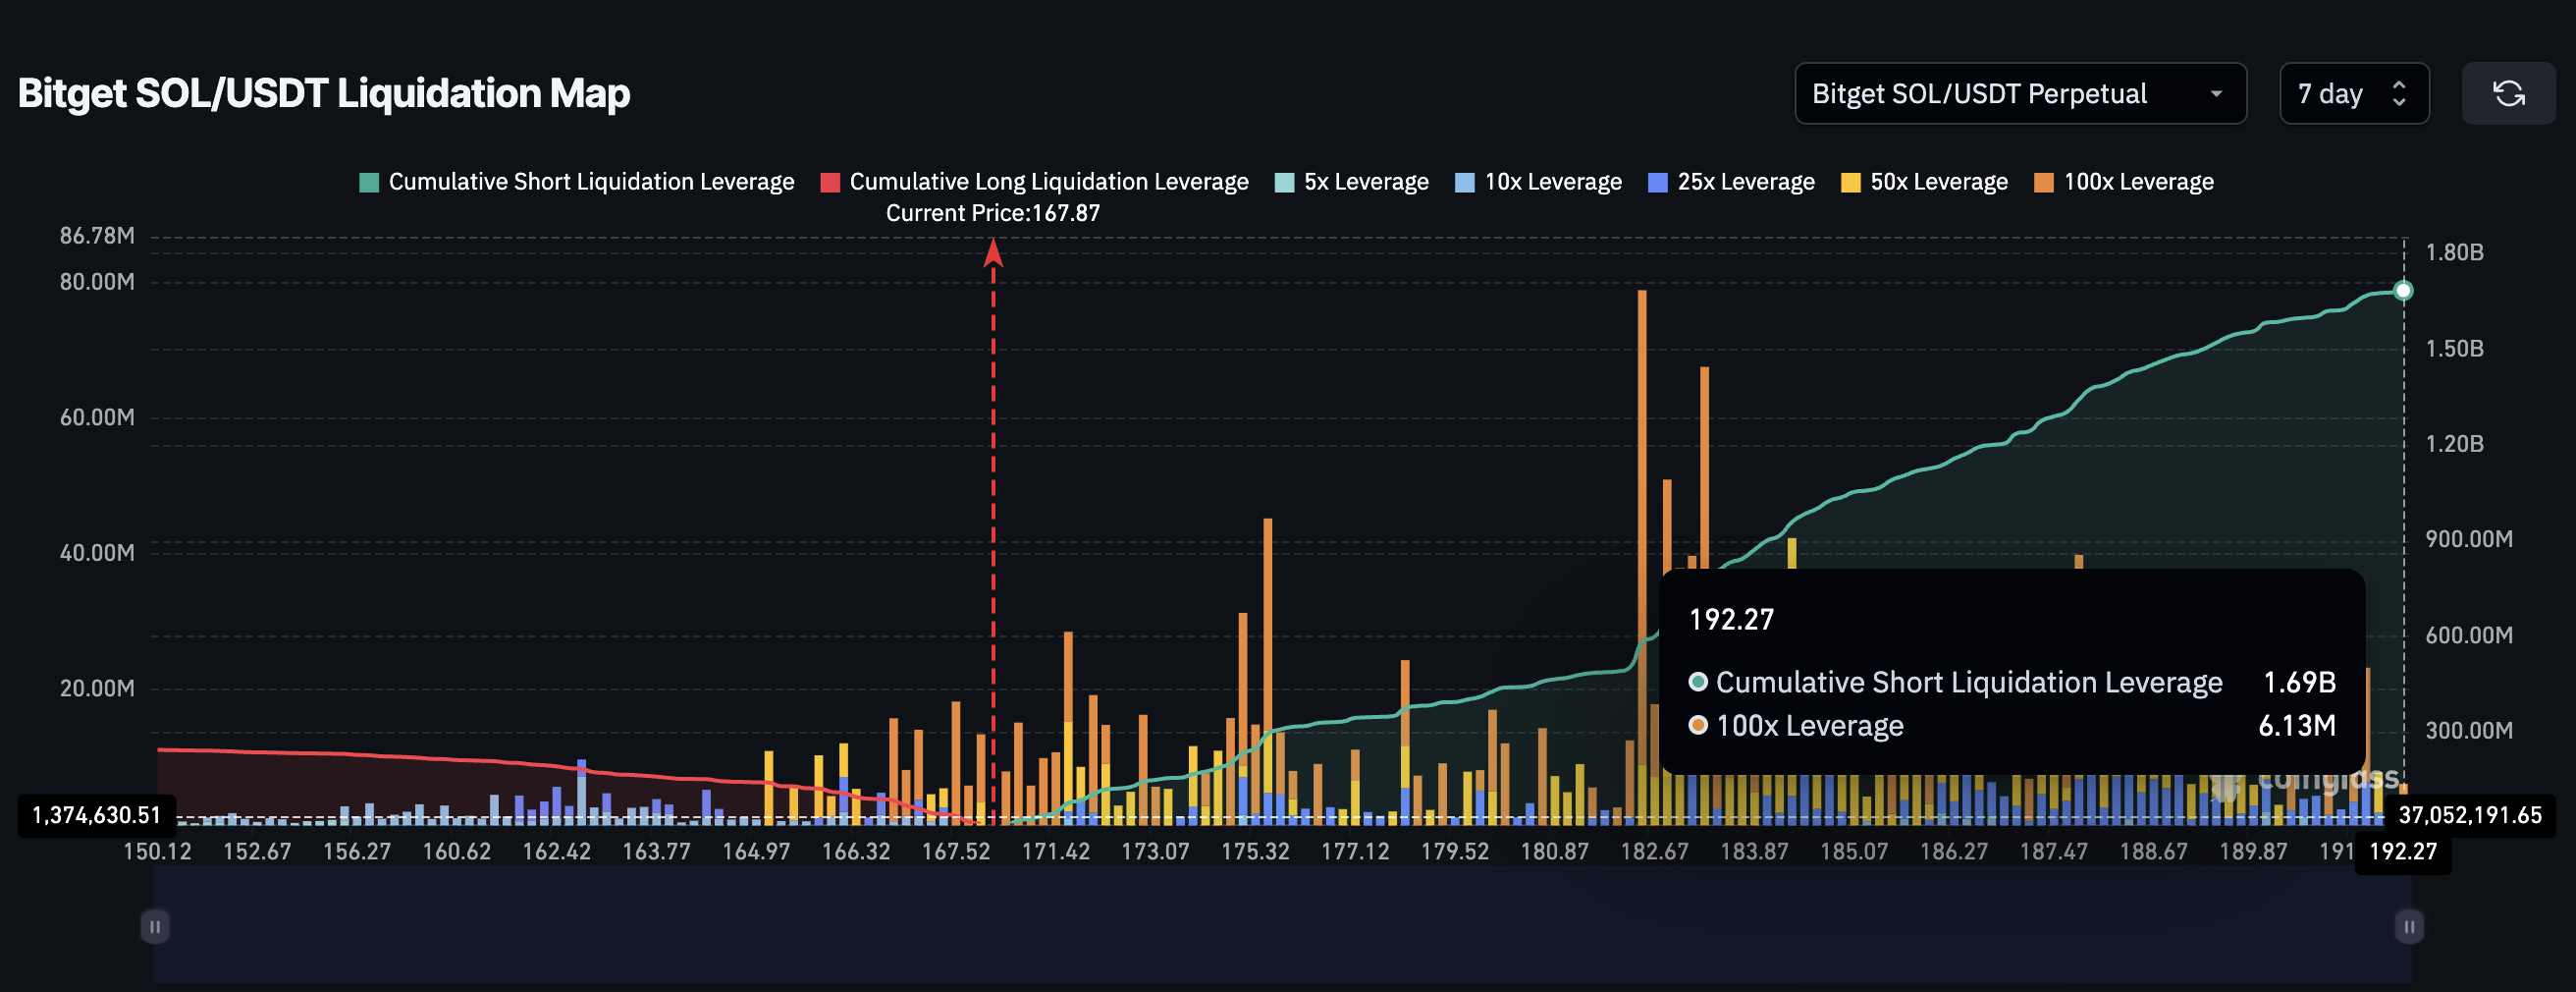 Solana 7-day liquidation map:
At the same time, the Bull-Bear Power index has been negative for three consecutive sessions, its longest red streak since June. This indicates sellers are firmly in control, pushing price action lower despite occasional attempts to recover.
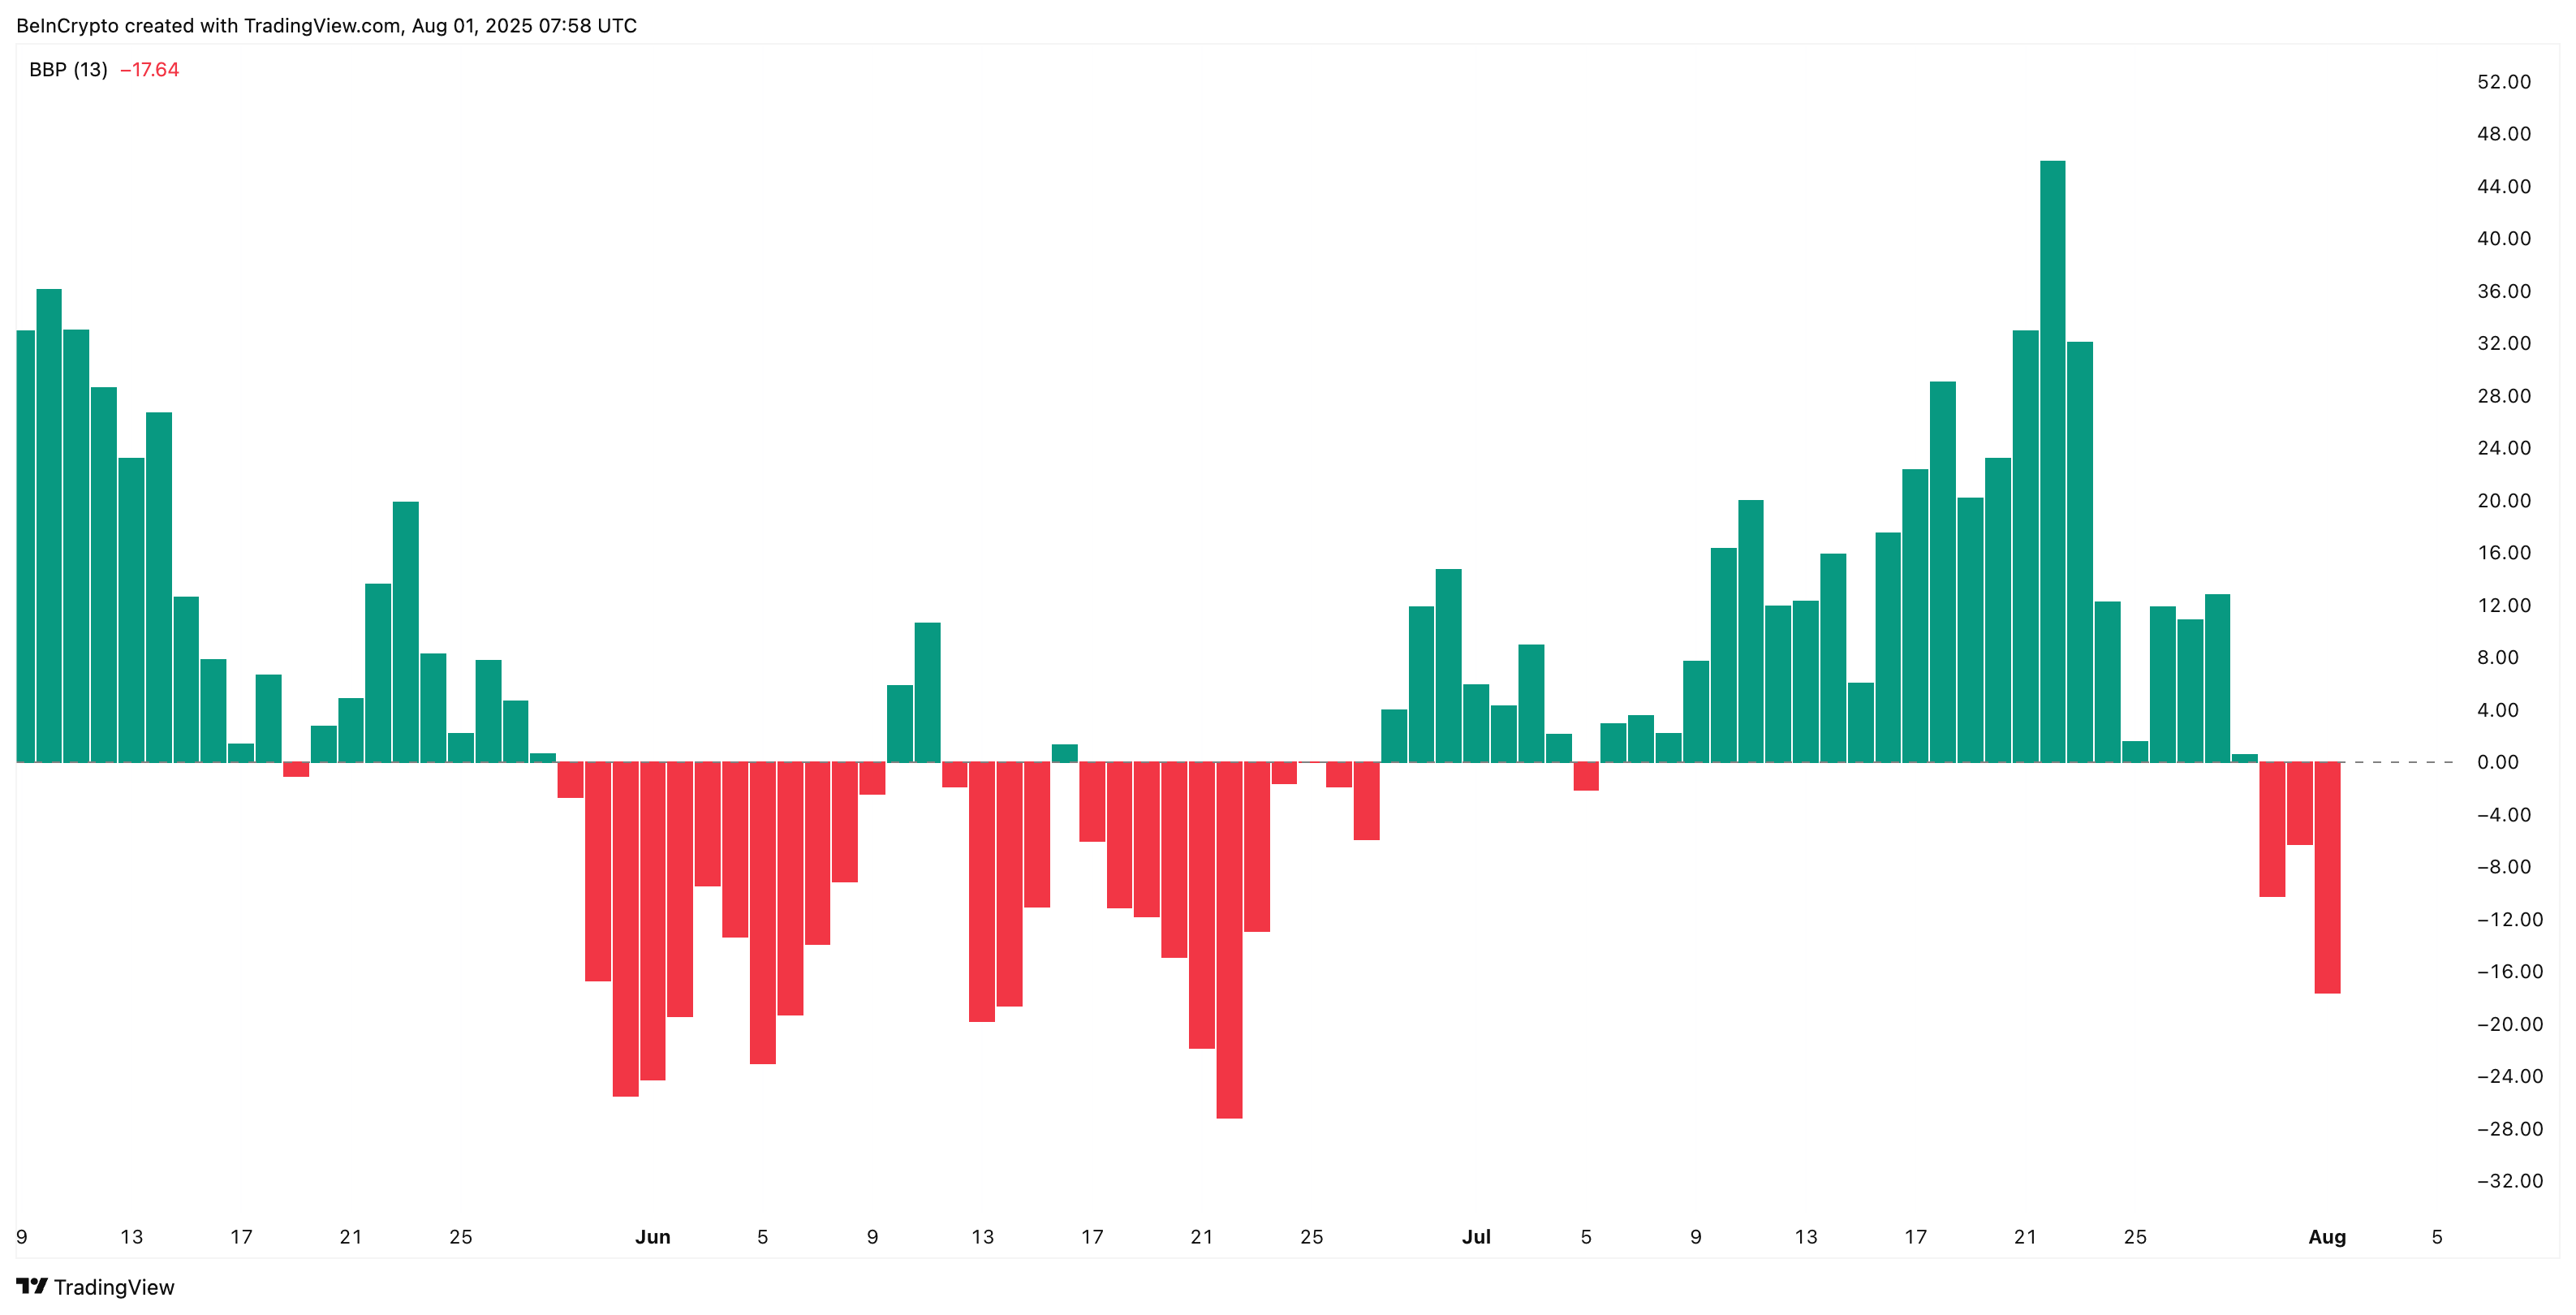 Solana bears have taken control:
If, however, Solana bounces sharply and regains momentum above $175–$180 (levels mentioned later in the piece), these heavy shorts could become fuel for a short squeeze, creating a bear trap. For now, though, the pressure is clearly tilted to the downside, and a trap setup doesn’t look likely.
For token TA and market updates: Want more token insights like this? Sign up for Editor Harsh Notariya’s Daily Crypto Newsletter.
Solana Price Action Puts $166 In Focus
Technically, the Solana price has broken down from its ascending wedge on the daily chart, snapping a pattern that had supported the July rally. The immediate support level to watch is $166, aligning with the 0.5 Fibonacci retracement zone from the $206 high. Losing this area could open a deeper slide toward $156 or even $143.
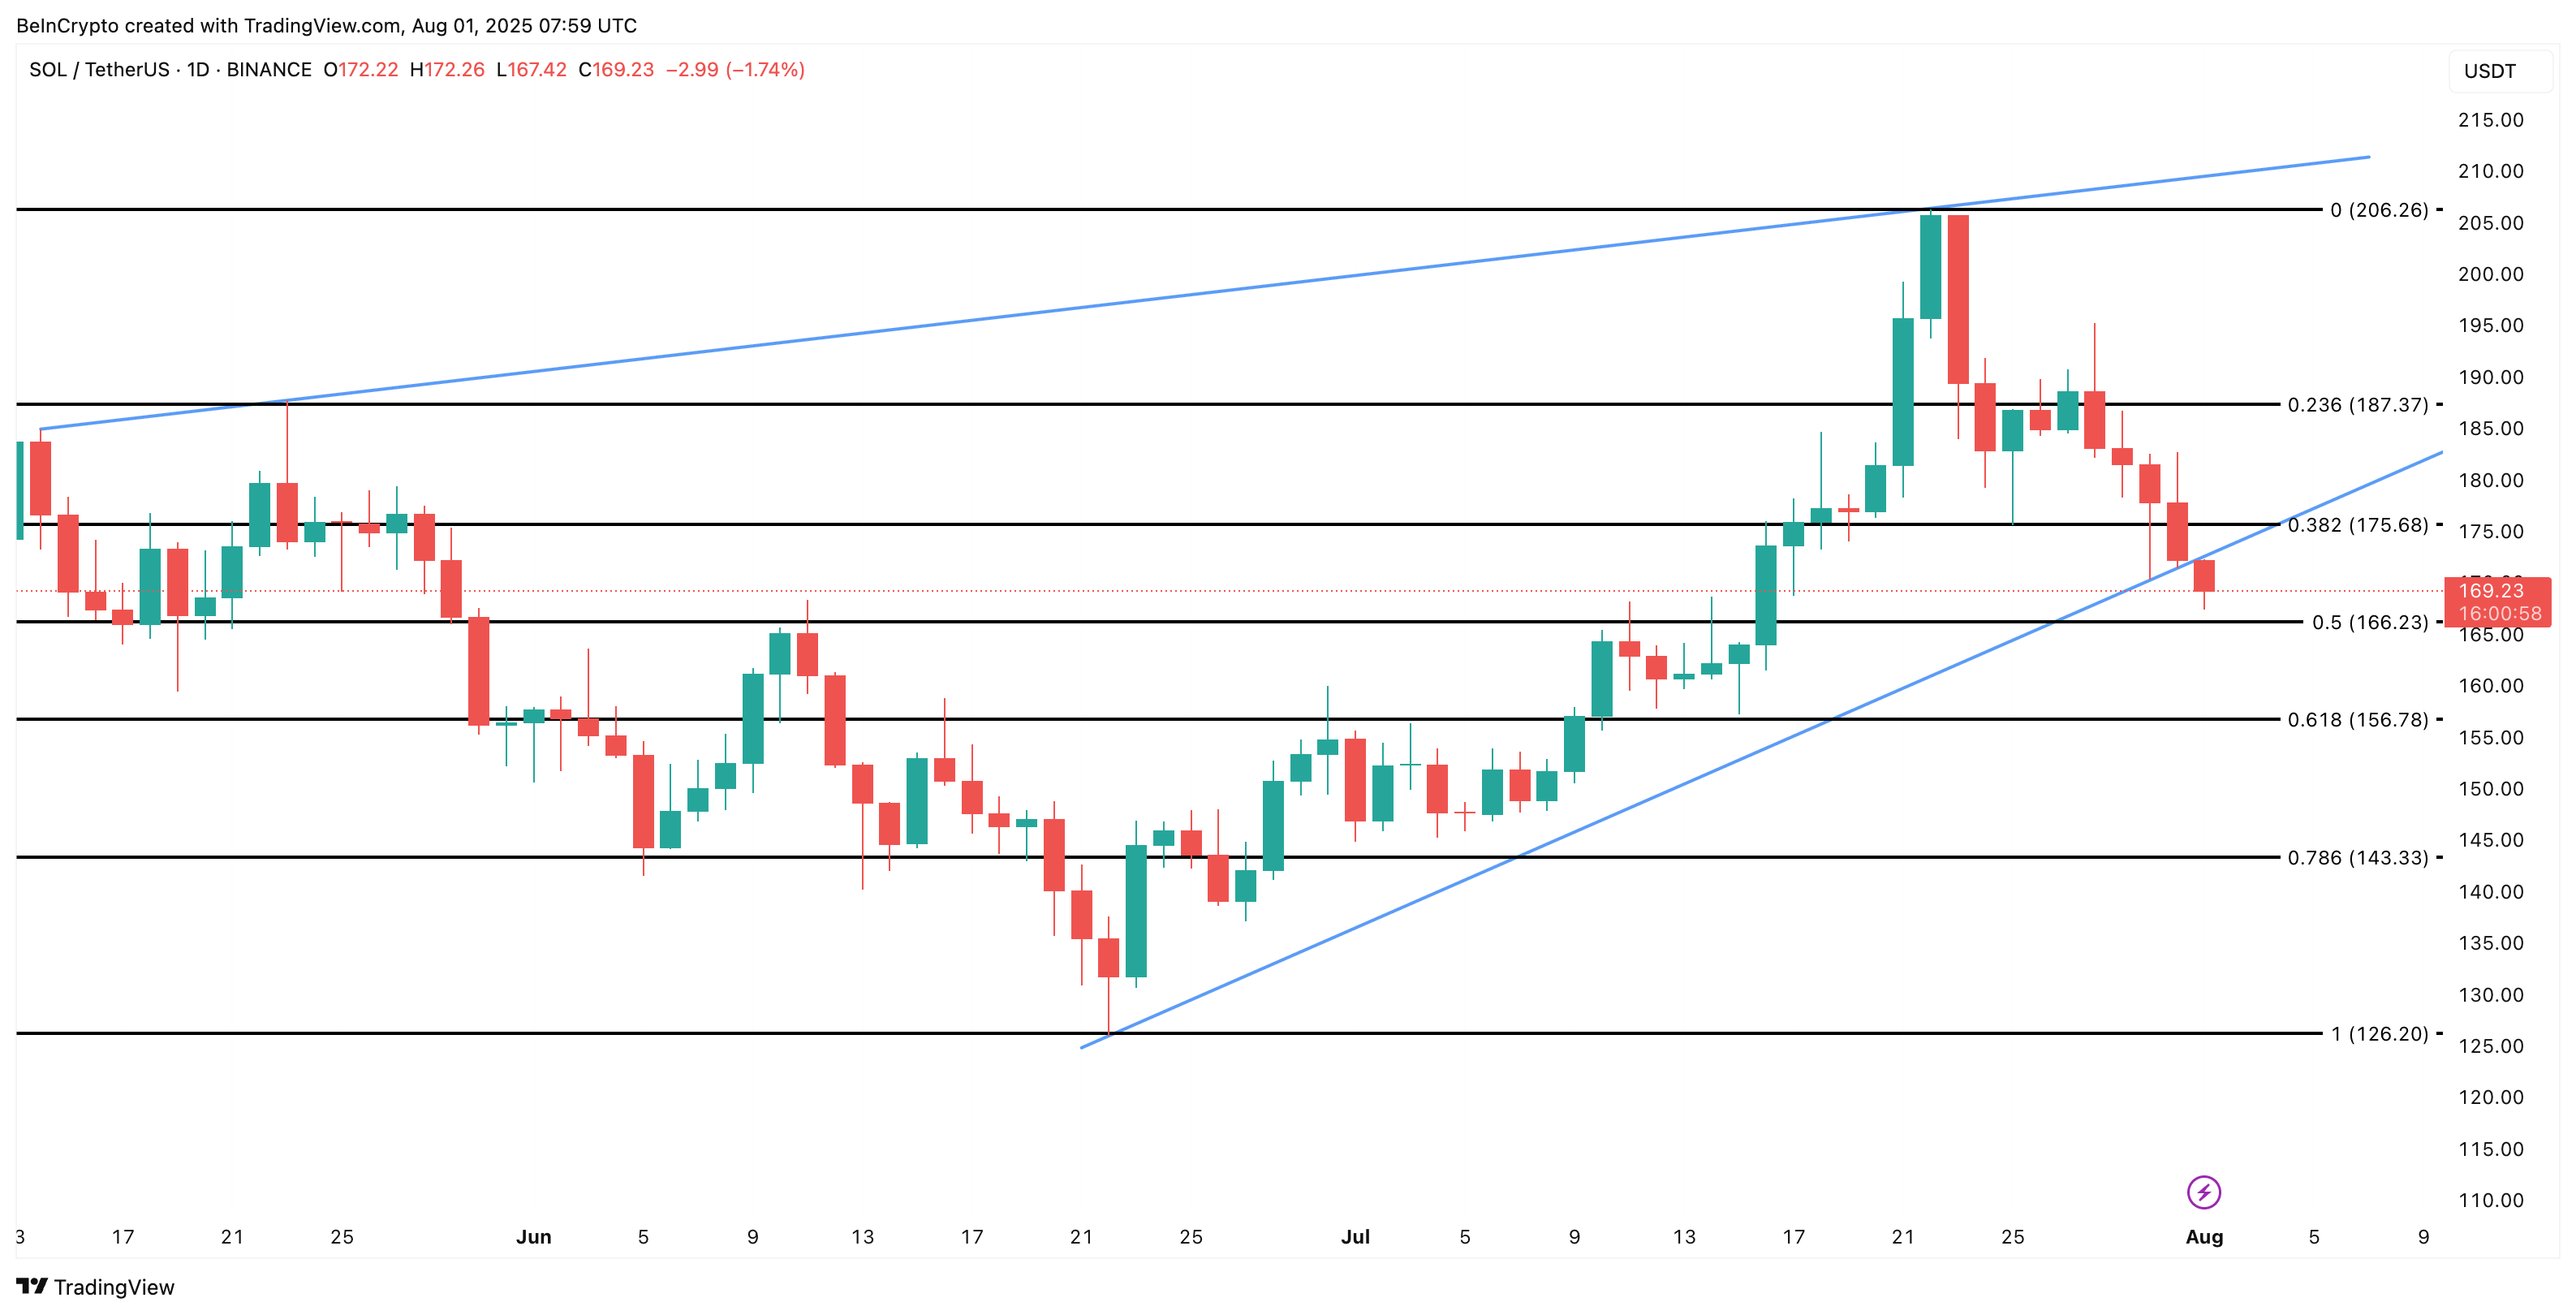 Solana price analysis:
To invalidate this bearish scenario, Solana needs three things in quick succession:
- User activity must rebound, signaling stronger demand.
- Price must reclaim $175–$180, forcing shorts to unwind.
- A daily close back inside the broken wedge, restoring the bullish structure.
Only if all these conditions align could this setup morph into a classic bear trap, flipping sentiment back in favor of bulls. Until then, the Solana price remains under heavy pressure, with the risk of more losses ahead.
Disclaimer: The content of this article solely reflects the author's opinion and does not represent the platform in any capacity. This article is not intended to serve as a reference for making investment decisions.
You may also like
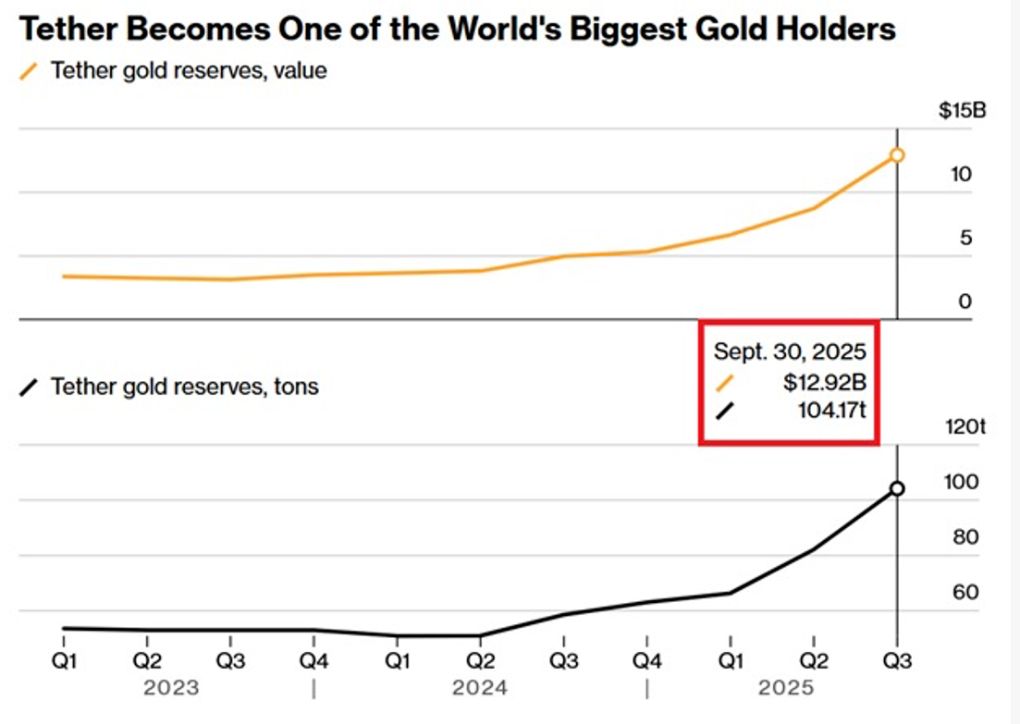
Digital dollar hoards gold, Tether's vault is astonishing!
The Crypto Bloodbath Stalls: Is a Bottom In?

Can the 40 billion bitcoin taken away by Qian Zhimin be returned to China?
Our core demand is very clear—to return the assets to their rightful owners, that is, to return them to the Chinese victims.