- XRP Dominance has reclaimed and sustained the 4.5% level, reinforcing a bullish pennant formation on the monthly chart that signals macro-level strength.
- The current structure mirrors previous triple-bottom reversals that led to major rallies, with Fibonacci targets pointing toward 11.44%, 21%, and even 31.54%.
- The breakout from a long-term downtrend channel is undergoing a critical retest; confirmation could trigger a powerful upside continuation.
XRP Dominance is currently holding above a crucial 4.5% threshold, reinforcing the integrity of a long-term bullish pennant formation. This level remains vital on the monthly timeframe, where chart patterns tend to reflect broader, more stable trends. Following a successful breakout from its historical downtrend channel, XRP Dominance has entered a critical retest phase that could determine its next directional move.
 Source: (X)
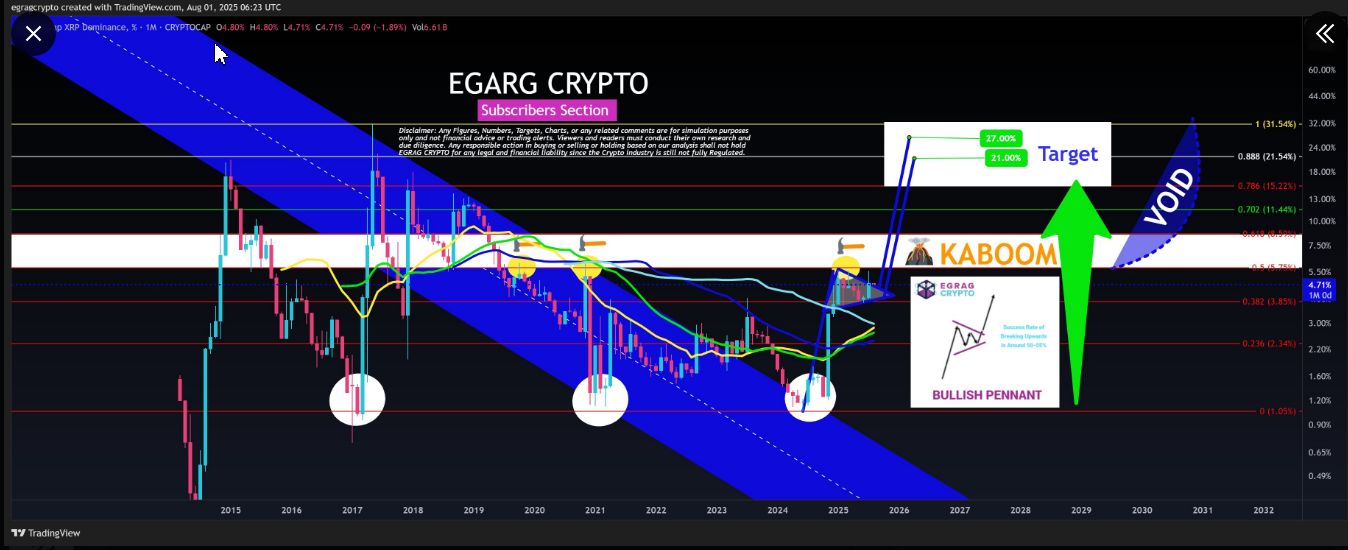
Currently, XRP Dominance stands at 4.71% with monthly volume reaching 0.61B. The structure under review echoes prior formations that preceded strong upward price expansions. A series of well-defined support reactions, circled in the chart, align with the bullish pennant boundaries that have been intact for multiple years. This retest of the breakout point, if confirmed, may act as a launchpad toward higher Fibonacci levels.
Monthly Structure Forms Repeatable Pattern Seen in Past Reversals
Historical behavior shows XRP Dominance bouncing off a clearly marked long-term blue channel, repeating a three-cycle base formation. Each of these formations resulted in sharp upward expansions, suggesting recurring accumulation zones that precede dominant market phases. At the current structure, XRP is once again showing signs of building within a triangular squeeze, respecting major EMAs.
Notably, the current bullish pennant is forming directly after a key trend reversal that occurred in late 2022. XRP Dominance has climbed steadily since then, retracing into consolidation, and now retesting the prior breakout region. If the structure holds, upside Fibonacci targets point to 11.44%, 15.22%, and a maximum level of 31.54%, corresponding with previous reaction zones.
XRP Price Trades at Support Amid 7-Day Decline
While dominance charts reflect broader market positioning, XRP’s price action shows shorter-term retracement. As of writing, XRP was trading at $2.95, down 5.9% over the last 7 days. Its current 24-hour price range has remained between $2.91 and $3.17. The $2.91 level provides near-term support, while $3.17 serves as resistance.
Despite the weekly decline, XRP remains above its historical pivot, indicating that the overall macro structure is intact. This aligns with the dominance chart’s consolidation phase and retest action. However, price continuation above $3.17 would require increased participation across major trading pairs, especially as dominance seeks to confirm breakout strength.
XRP Dominance Builds Bullish Pennant with Breakout Potential
XRP Dominance’s bullish pennant formation currently supports two potential target zones on breakout: 21.00% and 27.00%. These targets correspond with historical rally patterns where similar structures produced substantial upside moves. A break above the 6.15% resistance level may open access to the “void zone,” where historical trading volume remains thin and momentum accelerates.
The Fibonacci retracement structure supports this thesis, with XRP Dominance currently sitting between the 0.382 and 0.5 levels. Any sustained movement above 5.5% could validate this trajectory. While price remains in consolidation, the monthly timeframe maintains bullish momentum with support from moving averages and pattern continuity.